Tagged: failures

Hidden Failures in Lubrication programs: Designing a Resilient Lubrication Strategy Part 3

Before you begin to design a resilient lubrication strategy, you need to know where your current lubrication strategy falls as per industry standards. You can review part 1 in this series where we break down the various levels of maturity for lubrication programs. Afterwards, determine your hidden failure modes which you can read about in part 2 of our series.

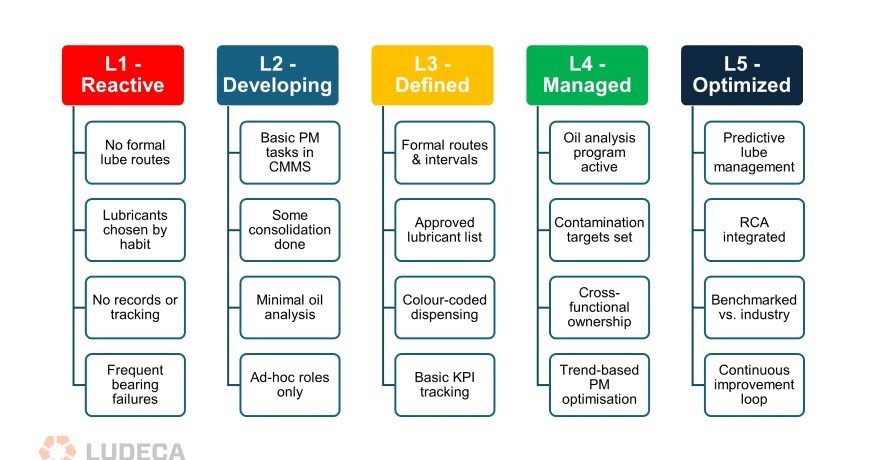
As a quick refresher, here are the various maturity levels for lubrication programs.
Varying-levels-of-Maturity-for-Lubrication-Programs_870x460 (1)
Figure 1: Varying levels of Maturity for Lubrication Programs

Once the current lubrication program level is identified, we then need to audit the systems that we have in place to understand what gaps need to be filled. While wanting to achieve level 5 is always the goal, we also must be cognizant of our constraints. Within our industry, some constraints which typically exist include; budget, manpower, resources and time. Each of these have crucial roles to play in determining the success of our lubrication program.

Closing the gaps

Once your gaps have been identified, this is not the end of the story. We need to put procedures and strategies in place to make sure that we can close these gaps. This is where we get to re-evaluate work orders, ensure that they are now being aligned with our condition monitoring programs and design our systems to have proper lube routes as well as frequencies or relubrication with the correct lubricant.

After auditing our condition monitoring program (which forms part of the lubrication program), we should also assign dedicated personnel for interpretation of oil analysis results as well as sampling. Being able to access consistent data and trending will help us to understand our equipment better and possibly detect failures before they occur.

Part of auditing of condition monitoring program includes setting up alarm limits within our system which are aligned to our equipment and environment. While the lab will have the standard set of alarms, we should take a closer look at what really resonates with our equipment. For instance, if we start seeing a spike in copper right after a turnaround where certain parts were changed, then this may be normal and just break in wear. However, the lab may flag it as a component failing (if we did not provide them with adequate details).

Contamination

One of the biggest sources of failures for our equipment is contamination. By designing our lubrication program to eliminate sources of contamination (within or control), we can essentially minimize equipment failure. Most contamination can happen during oil transfer to equipment where the oil may either be placed in dirty containers, or have contaminants enter their packaging from improper storage conditions.

By designing our lubrication program to address contamination and have measured results as goals for our program, we can improve our systems. Without clear cleanliness targets we cannot evaluate the impact of reducing contamination. Desiccant breathers and proper sealing techniques can also help in reducing the ingress of contaminants into the system.

Training and Accountability

Designing a lubrication program must also include the training of the employees to execute the program. They are the ones responsible for its success and if not trained or briefed about the importance of their assigned roles, then they will not bring the value to the program and unfortunately, it will fail.

By allocating responsibilities to employees and having them accountable for these roles it brings some form of ownership into the program. This allows the program to thrive more as they are genuinely invested in making it a success. Once they have been trained, they can in turn continue to spread the word about lubrication and best practices to their peers.
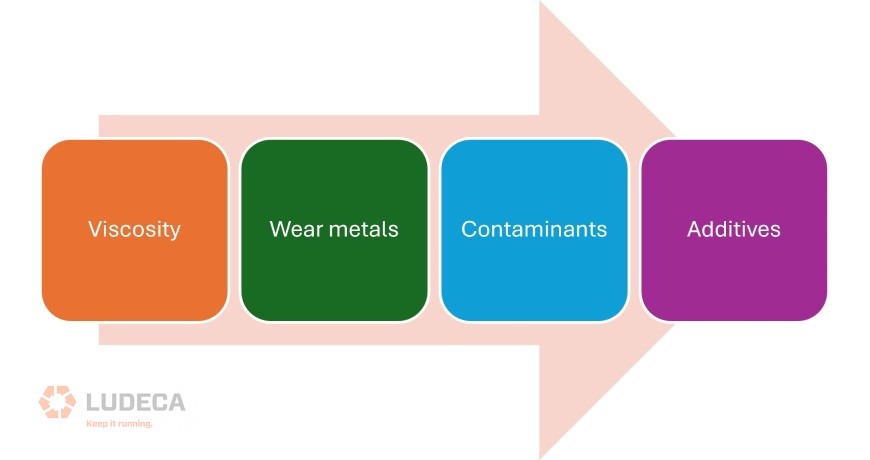
oil-analysis-test-to-identify-health-of-lubricant_870x460
Figure 2: Oil Analysis Tests which can be performed to identify health of lubricant

Essentially, we can have hidden failures in our lubrication programs, but we can uncover these and redesign our program to become a success through auditing and putting proper strategies in place. Next time you think about your lubrication program, explore its robustness and think about ways in which you can improve it to ensure that it is adding to the value that it should.

Hidden Failures in Lubrication programs:  Failure Modes Which Are Not Being Monitored Part 2

In part 1 of this series, we took a closer look at the Illusion of a Good Lubrication Program. One of the key findings was that through audits, failure modes were not being monitored actively or in some cases not at all. In this part of the series, we will do a deeper dive into the failure modes that can be missed with lubrication programs.

Critical but not obvious failure modes

With our standard oil analysis programs, there are a few key tests that can indicate the health of an asset. These include; viscosity, presence of wear metals, contaminants, additives, moisture levels and cleanliness levels (ISO 4406). From these tests, we can easily identify if we may have some cause for investigation or concern.

oil-analysis-test-to-identify-health-of-lubricant_870x460
Figure 1: Oil Analysis Tests which can be performed to identify health of lubricant

If there are changes in viscosity this can be an indication of a few different things. A decrease in viscosity can indicate that there is possible contamination with fuel or even thermal cracking of the lubricant. However, if the viscosity increases, this can indicate contamination with water (or another higher viscosity grade lubricant, accidentally) or the presence of oxidation degrading the lubricant.

The presence of wear metals can indicate that there is wear occurring within your components. However, there are varying limits depending on the type of oil and the application in which it is being used. For instance, the alarm limit for iron in diesel engines is usually around 60ppm while the alarm limit for iron in gearboxes is closer to 300ppm (this will vary by OEM). As such, it is important to set appropriate alarm limits for various components and oils depending on their applications and environments.

If there is the presence of contaminants, this can easily flag that something is getting into the system (either via an external or internal source) which shouldn’t be there. Contaminants can also act as catalysts to speed up degradation of lubricants. Again, they have varying limits depending on application and type of oil, but they should be monitored.

By understanding the concentration of additives and observing their trends, we can also determine if wear is occurring (by the decline in antiwear additives) or if oxidation is happening (by the decline in antioxidants). By quantifying the concentration of additives, we can also determine if there was possible contamination with another lubricant (if an element shows up which should not be there!). Through the monitoring of additives, we can quickly determine the internal conditions that the lubricant is exposed to, whether or not wear is occurring and if contamination is present.

Assessing the Gap

These tests can give an indication of what’s happening inside your oil before the failures occur. Through proper trending and by establishing alarm limits which can warn users in time, failures can be avoided. This is the value of developing a robust lubrication program where impending failures can be detected, avoided and uncovered before they cause any harm to our system.

Stay tuned for part 3 where we dive into designing a resilient lubrication strategy.

Hidden Failures in Lubrication programs: The Illusion of a Good Lubrication Program Part 1

Typically, when lubrication programs are developed and implemented, everyone automatically believes that all lubrication issues have been solved and will never occur again. This is furthest from the truth! In this 3-part series, we will explore some of the hidden failures in lubrication programs. We will start off with dispelling the illusion of a good program then dive deeper into the failure modes which are not being monitored and finally, ways to design a resilient lubrication strategy.

How “good’ is good?

Many manufacturing plants have some form of a lubrication program in place. But many are not familiar with how to gauge this against best practices or industry standards. The following figure gives a brief description of the various stages of a lubrication program that can exist.

Varying-levels-of-Maturity-for-Lubrication-Programs_870x460 (1)
Figure 1: Varying levels of Maturity for Lubrication Programs

Although many plants may fall within the L2-L4 stages (and some in the L1 stage), there is still a lot of data missing on the documentation on lubrication failures and how these are being addressed (if they are being addressed at all). As such, there are no direct actionable items that link failures to strategies for preventing these in the future.

Industry standards attribute that around 33% of bearing failures are due to lubrication challenges. However, if our lubrication program is not capturing these lubrication related failures then the real root causes are not being addressed directly for these issues. As such, they are not being solved and we are adding to the overall unreliability of the plant. In these instances, our lubrication program is not adding value from a reliability perspective and is actually hiding some failures.

The real failures

Lubrication can account for a significant number of failures, but contamination also plays a crucial role. As per a study carried out by NRCC & STLE (National Research Council Canada & Society of Tribologists and Lubrication Engineers), particle induced failures are responsible for approximately 82% of failures. This means that our equipment is majorly failing because of contamination.

In our “Defined” maturity level 3 program, contamination is not even addressed. Hence, we could be missing the opportunity to remove this from our system and by extension reduce failures associated with contamination. With our level 3 program, we also do not have alarm limits for our oil tests to help us understand if we are approaching dangerous levels or not. This will cause us to miss opportunities where we could have prevented components from failure.

Even with a moderately tiered lubrication program, we are missing a lot of opportunities for improvement of the overall reliability of our plant. This can lead to the lubrication program being viewed as unsuccessful when in fact, it just didn’t capture the right data.

Apart from capturing data, we also need to act on that data. Even if we have an oil analysis program in place, if we are not trending the data or coordinating with our maintenance teams to troubleshoot potential issues, then the lubrication program is not helping to raise the reliability of the plant. The program is in fact hiding some of these inefficiencies.

When was your last audit?

Even though we may have built a lubrication program, have we audited it? Creating a lubrication program may be an easy feat for many but implementing it is another story in itself. This is where some programs fail because they exist on paper but not in practice. If our technicians are not collecting the right data or observing proper storage and handling techniques, then the lubrication program is just another piece of paper in the drawer collecting dust.

For those who have managed to get the lubrication program off the ground and have the right people integrated into it, an audit on the program is still a good idea. Sometimes when these programs are launched, the personnel responsible are excited to implement the new strategies but complacency can easily step in. This is when the quality of the results of the program can erode.

Your program may no longer be catching your failures in advance, and this can lead to a loss in production, emergency repairs and even unplanned shutdowns. Performing annual audits on your lubrication program to ensure that it is delivering actionable results is highly recommended.

Many failures and incompetencies can hide behind a “good lubrication program” but with proper auditing and identification of where your lubrication program actually measures up, you can take actions to make it a successful program.

Stay tuned for part 2 where we will be diving deeper into the failure modes that are not being monitored.

Lubrication failures in Industrial plants

When failures occur in industrial plants, the first culprit to be suspected is usually the lubricant. However, should this be the first area that one looks at and what are the main causes of the lubricant failing? To understand this, I’ve taken a look at lubrication failures in industrial plants both globally and locally to understand the impact that they have on the sector.

Van Rensselar(1) explained that a recent study conducted by ExxonMobil Lubricants & Specialities of 192 US based power plants, 40% of these have reported issues of varnishing within their facilities. On the other hand; Livingstone, Prescott and Wooton(2) describe a study carried out by EPT Inc which document 44% lubrication failure of gas turbines (not including GE Frame 7FA & EA). It is therefore clear to see that there exists a prevalent issue of lubrication failure within the industry.

When a lubrication failure occurs, it costs an estimate of USD100,000 per trip in a power plant(1). As such, lubrication failures are costly within the industry and methods to reduce issues relating to these types of failures should be explored. Van Rensselar(1) also interviewed Joe Z. Zhou senior research chemist for Chevron Lubricants in Richmond California who explained that one of the main causes of varnish is the primarily oxidized hydrocarbon molecules which undergo surface aggregation and further surface reaction to produce the varnish. However, Livingstone and Oakton(3) add to this description of the main causes of varnish as the oxidation of the oil whereby there is a loss of electrons from the molecules within the lubricant. They go on to state that hydrolysis and thermal degradation are also leading factors for the degradation of the lubricant.

Van Rensselar(1) explored the main cause of such increased volumes of varnish cases in recent times and found that due to changes in turbine designs to allow for reduced operating and capital costs, the clearances have become smaller, operations are now continuous and a common lubricant for both bearings and controls is now being used. With the reduced clearances, the lubricant can now heat up faster and allow for quicker oxidation occurrences thus leading to varnish. Additionally, with the use of a common lubricant for bearings and control functions, there are significantly different levels of filtration required. Bearings allow for at least a 200-micron filtration system whereas servo valves will accept nothing less than 3-micron filtration(1). As such, it has now become easier for servo valves to become clogged due to varnish as compared to instances in the past.

Case Studies

Johnson, Wooton, and Livingstone(4) describe a case study on a power plant in Arizona, USA where a failure occurred during a routine test. Upon inspection, soft varnish/sludge was found on the trip valve piston. The varnish/sludge was analysed using FTIR testing and its chemical properties suggested the presence of carboxylic acid, primary amide and methacrylate ester. Further investigations revealed that the varnish had accumulated in a uniformed fashion. However, MPC testing did not reveal significant varnish accumulation since these tests were conducted monthly and the varnish had accumulated significantlyduring that time. Upon performing a root cause analysis, it was discovered that a steam leak containing hydrazine gave rise to the presence of ammonia in the system which reacted with the carboxylic acids (produced from oxidation of turbine oils) to form varnish within the system. It was then decided that lower MPC levels were needed to manage the volume of varnish within the system and reduce the steam leaks into the oil. These actions were taken to ensure that the varnish levels could be managed such that there would be no future trips as a result of this issue.

Wooton and Livingstone(5) conducted another case study on a combined cycle power plant in the US which experienced a type of lubrication failure. The plant had been shut down during an outage and it was noticed that when the lubricant storage tank cooled past 32°C large black tar balls formed and floated at the surface of the tank. The filters appeared to contain the black tar when in a liquid form but when allowed to cool, the tar turned into a black / brown solid. FTIR testing on the deposit revealed decomposed amine antioxidant, an ester and an additive not characteristic of the lubricant in service. The non-characteristic additive was identified as a foam inhibitor which was not found in the lubricant in service. It was then concluded, that an incompatible fluid was mixed with the in-service lubricant. A quality control program was implemented to ensure that all the incoming fluids are compatible with the in-service lubricant. As such, for this case study, lubricant degradation occurred due to contamination.

Trinidad & Tobago

After conducting a lubrication survey with turbine users for the period 2014-2015 and it was found that within Trinidad & Tobago, turbine users can be classified into three main categories namely; Power generation, Oil & Gas and Petrochemical. It was found that internationally, there is a greater focus on the Power Generation sector in research regarding lubrication failures. However locally, Power Generation represents 40% of turbine users while Petrochemical represents 34%. On the contrary, it was found that the Petrochemical sector suffered more lubricant degradation issues as compared to the Power Generation sector from this study. Overall, the Petrochemical industry experienced the highest volume of lubricant failures.

Overall, it appears that while Power generation sector has a higher percentage of turbine users, locally the Petrochemical sector emerges as the larger shareholder of lubrication failures in the industrial sector. Given that most of the lubrication failures occurred via oxidation and contamination (both locally and internationally), one can only conclude that within the industrial sector a greater emphasis should be placed on the monitoring of the condition of the lubricants especially for critical equipment. When lubrication failures occur, they can be very costly, as such greater emphasis should be placed on the monitoring of these lubricants in service.

References:

1 Van Rensselar, Jeanna. 2016. “The unvarnished truth about varnish”. Tribology & Lubrication Technology, November 11.

2 Livingstone, Greg, Jon Prescott, and Dave Wooton. 2007. “Detecting and Solving lube oil varnish problems”. Power Magazine, August 15.

3 Livingstone, Greg and David Oakton. 2010. “The Emerging Problem of Lubricant Varnish.” Maintenance & Asset Management, Jul/Aug.

4 Johnson, Bryan, Dave Wooton, and Greg Livingstone. 2013. “Root Cause Determination of an Unusual Chemical Deposit on a Key Oil Wetted Component.” Paper presented at OilDoc Conference and Exhibition Lubricants Maintenance Tribology, OilDoc Academy, Brannenburg, Rosenheim, Germany, United Kingdom, January 22-24, 2013.

5 Wooton, Dave and Greg Livingstone. 2013. “Lubricant Deposit Characterization.” Paper presented at OilDoc Conference and Exhibition Lubricants Maintenance Tribology, OilDoc Academy, Brannenburg, Rosenheim, Germany, United Kingdom, January 22-24, 2013.


Written by Sanya Mathura, CEO & Founder of Strategic Reliability Solutions Ltd.