Category: Oil Properties

From Measurement to Action

Start measuring the air in your system. The most useful air-in-oil measurement is not the...

The 360 Approach – One Shared Data Language Across the Lubrication Value Chain

At Deepfluid, they have adopted a 360 approach where they can assist all the stakeholders...

Case Study – From Abnormal Air-in-Oil Data to a Targeted Seal Investigation

Deepfluid’s direct measurement system can be used not only to analyze the interaction between oil...

One Portfolio for Controlled and Dynamic Evidence

The Deepfluid portfolio applies this methodology through three connected solutions.   The Air-in-One Lab Analyzer...

One Shared Data Language – From Lab to Field

Particularly for OEMs, it is important to be able to transition the product from the...

AIR as a Practical Lab-to-Field Framework

The Deepfluid AIR Framework turns insights from bubble-level evidence into three entirely new practical engineering...

How Air in Oil gets Measured

Typically, oil condition monitoring is performed through standardized laboratory tests at specified intervals. A representative sample is taken on-site...

Turning Air Measurements Into Reliability Insight

The Smart Bubble System, developed by Evamo, allows users to gain deeper insight into the...

How Is Air in Oil Measured?

When we think about measuring air in oil, the top-of-mind lab tests that are well...

The Chemistry Behind Air in Oil

The oil’s chemistry also plays a significant role in determining its air content. All finished...

How Does Air Get Into Oil?

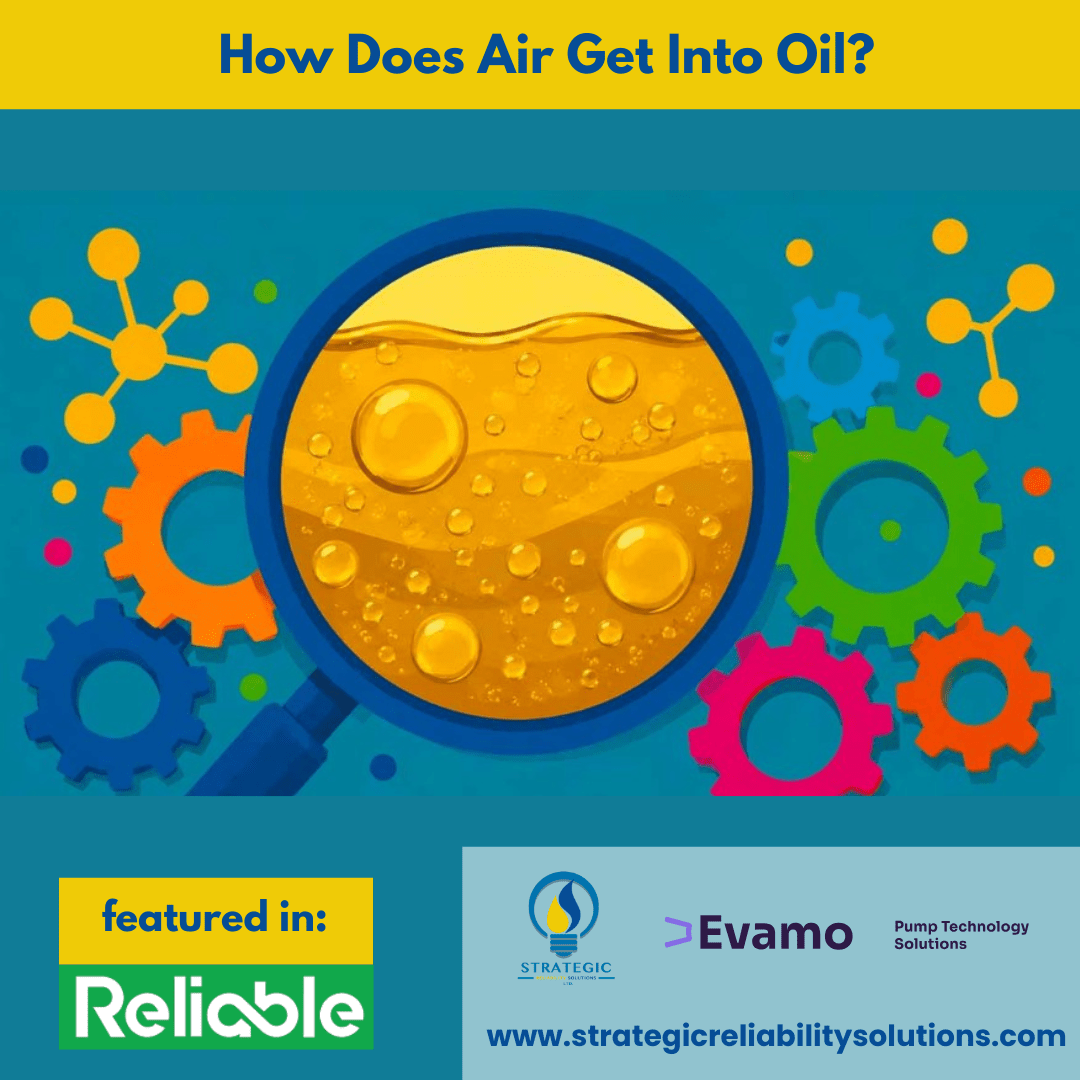
Air is inert, so it shouldn’t affect your oil, right?! This is a concept that...

What Tools Can Be Used to Monitor Additive Depletion?

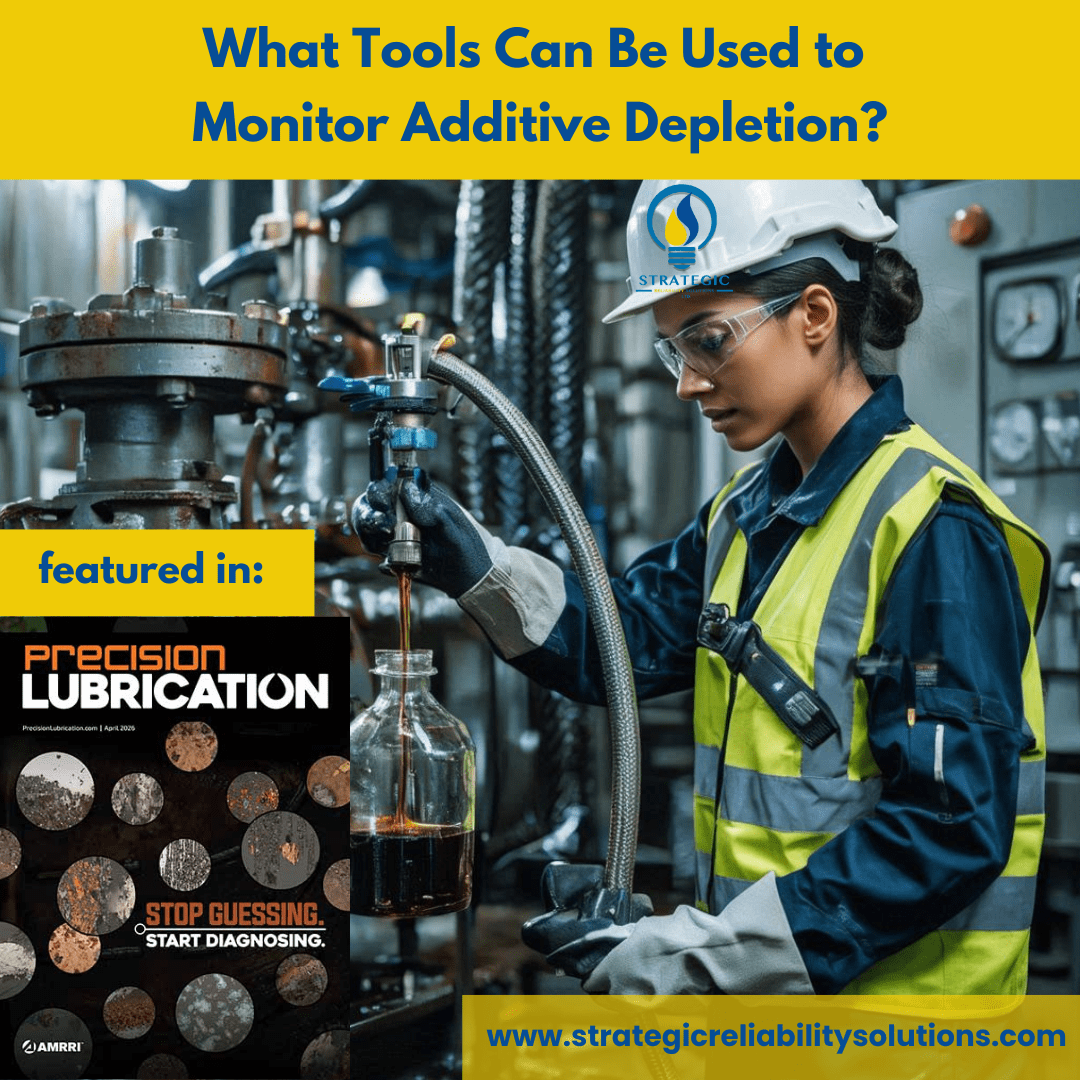
There are some basic analytical tools that can be used to measure the quantity of...

How Can Additives Deplete?

Additives can be depleted through different mechanisms. Some of these include: Regular consumption through normal...

Why Do Additives Matter?

Oils are composed of base oils and additives. Typically, additives are sacrificial; they deplete first...

Role of Condition Monitoring, Human & Organizational Factors in Oil Failures

Choosing the right oil for the system is just one part of the puzzle. How...

Common Modes of Failure for Lubricants

Regardless of the oil selected, common modes of failure can occur with every lubricant. These...

Spec Sheet vs Strategy for choosing the right oil

Sometimes we can spend hours poring over technical data sheets, comparing oil performances, and finally...

Critical Condition Monitoring Tests for Compressor Oils

To ensure these oils remain healthy (and not contaminated or degraded), a few basic tests...

Refrigeration Lubricants

For industrial refrigeration systems, there are a couple of essential pieces of information to consider...

Industry Standards for Compressor Oils

Some other classifications which users may see when dealing with compressor oils (even though some...

Types of Compressors and Oils

Compressors are integral to many of our operations. They are used to compress gas, increasing...

How to identify the Root Causes of ESD in Lubrication

Thus far, all the prevention methods have focused on the physical roots of ESD. We...

What are Effective Strategies to Prevent ESD in Lubrication?

ESD occurs when there is a buildup of static in the oil; therefore, one of...

Understanding Electrostatic Spark Discharge and Its Impact on Lubrication Systems

Electrostatic Spark Discharge typically occurs when static is built up in an oil at a...

Interpreting the Oil Analysis Report in Practice

According to the report, samples have been collected over a period of time. This helps...

How to Interpret Your Oil Analysis Results

Depending on the application and operating environment, certain conditions may be met that can be...

Why Different Oils Require Different Tests

Oil analysis reports often wear an invisible cloak, and only if we have a wizard...

Sensors vs Traditional Oil Analysis

In this age of AI, it seems that everyone is moving towards sensors and online...

How do you set oil-analysis limits for diesel fleets?

What Baselines should you use? Global oil suppliers have baseline or tolerance limits that are...

Which parameters should you track in oil analysis?

      Every type of equipment will have different tests that should be performed...

What are the risks of pushing oil drain intervals beyond manufacturer limits?

Pushing drain intervals can lead to increased wear, contamination buildup, reduced lubricant efficacy and much...

What are the safety and environmental benefits of extending oil drain intervals?

Extending intervals reduces waste oil volume, lowers exposure risk, cuts disposal cost...

How much money can you save by extending oil drain intervals?

Before diving further into the condition monitoring aspect, we need to answer the question, “Are...

What is condition monitoring and why does it matter in lubrication systems?

Condition monitoring began as a way to detect anomalies in our equipment using various types...

What is the global market size and growth projection for hydraulic oil?

In 2021, the global size of the hydraulic fluid market was $7.6 billion, with a...

How should you store and dispose of hydraulic oil safely?

Proper storage of hydraulic oil prevents contamination; correct disposal reduces environmental impact and regulatory risk...

How do you select the right hydraulic oil for your system?

Choosing the correct hydraulic oil requires understanding system pressures, temperatures, contamination sources and OEM/specification demands...

Maintenance and Testing of Hydraulic Oil

Keeping hydraulic oils clean is critical to their operation, as any contaminant can interfere with...

What are the key properties and characteristics of hydraulic oil?

Hydraulic oils must be able to withstand particular conditions and still perform their primary function...

Testing and Analyzing Hydraulic Oil Composition

There are several basic tests that should be used to determine the condition and health...

Chemical Composition of Hydraulic Oil

Due to the unique nature of hydraulic oils, they are formulated differently from other oils...

Types of Hydraulic Oil

There isn’t just one type of hydraulic oil. Depending on the application, different standards are...

What is Hydraulic Oil?

Hydraulic systems are used to transmit force from one point to another via a fluid...

The Evolution of Engine Oil

Over time, engine oils have undergone significant evolution. Initially, there were only monograde oils, which...

How to Properly Dispose of Used Engine Oil

Approximately 42 gallons of crude oil are required to produce 0.5 gallons of new oil...

What are the Effects of Using the Wrong Engine Oil?

Sometimes, the wrong engine oil is used. Whether it’s an issue of the unavailability of...

How important is it to regularly change your engine oil?

Some oil manufacturers claim that their oil, when added to your engine, will remain “golden”...

Why are there Different Engine Oil Change Intervals?

There are more than 5000 models of engines that exist. Every engine was built to...

What are the benefits of using the right Engine Oil?

Various types of engines require different levels of performance, and engine oils have been specifically...

What are the types of Engine Oils?

When you walk into the auto repair store, it can be quite overwhelming with the...

What are some common misconceptions about Viscosity and Engine Oil Grades?

Many people believe that “thicker” oil is better for their vehicle. This is the furthest...

How to choose the Right Engine Oil Grade for Your Vehicle

All original equipment manufacturers (OEMs) provide a recommended range of oils for your vehicle, typically...

What is API & ILSAC Certification?

The American Petroleum Institute has a dedicated Engine Oil Licensing and Certification System (EOLCS), a...

What is Viscosity and how does that affect Engine Oil Grades?

Engine oil is a lubricating fluid designed to reduce friction and wear between moving parts...

Frequently Asked Questions About Machinery Lubrication

How Often Should Equipment Be Lubricated? This can change depending on your environment and operating...

Lubrication Maintenance Best Practices

We’ve already covered some mistakes; it’s time to look forward to some lubrication best practices...

Common Lubrication Mistakes and How to Avoid Them

Mistakes can happen all the time, but when we repeat them, they can become a...

Lubrication Regimes: Understanding the Science of Lubrication

The primary purpose of lubrication is to create an acceptable lubricant film to sufficiently keep...

Types of Lubricants and Their Applications

Not all lubricants are created equally! In fact, they need to be designed differently for...

Lubrication Explained

What is Lubrication? Lubrication is the process of reducing friction, wear, and heat between moving...

Storage and Handling & Advancements in Hydraulic oils

Hydraulic systems have smaller clearances than many. As such, it is imperative that these oils...

Are Consolidation and Cheaper Hydraulic Oils Worthwhile Considerations?

Given the various types of hydraulic oils that exist, can they all be consolidated into...

Are There Different Types of Hydraulic Oils?

Hydraulics comprise of lots of different operations as such, they will be called upon to...

What Are The Functions of Hydraulic Oils?

Hydraulic oils today need to provide longer oil drain intervals, better stick/slip characteristics, increased efficiency...

The Future of Gear Oils

The global industrial gear oil market is projected to reach USD 5.2 billion by 2027...

Gear Oil Storage and Handling

Gear oils should be stored in a clean, dry environment to avoid contamination and degradation...

How do Gear Oils Degrade?

Gear oils often experience a decline in antiwear, extreme pressure, rust, and oxidation additives due...

Gear Oil Characteristics and Naming Systems

Industrial gear oils must adapt to various environmental conditions, characterized by factors such as viscosity-temperature...

Is there more than one type of gear?

Gears are essential in various applications but experience friction and potential damage without proper lubrication...

Is Oil analysis still relevant today?

Advancements in AI, machine learning, and sensors complement, rather than replace, traditional oil analysis. While...

Oil analysis vs Other technologies

Oil analysis is akin to blood testing for machines, identifying wear particles and contaminants. Complementary...

Why oil analysis?

The P-F curve illustrates the expected functional failure point of a component. Among various monitoring...

What is oil analysis?

Oil analysis is akin to blood tests for the human body, assessing the condition of...

What are some innovations and future trends of Viscosity Index Improvers?

(Future Market Insights, 2024) estimates the Viscosity Index Improver market will be USD 4.06B in...

What impact do Viscosity Index Improvers have on Efficiency, Wear, and Degradation?

Viscosity index improvers, therefore, enhance the overall efficiency of these systems by maintaining the lubricant’s...

What is the role of Viscosity Index Improvers in Lubricants?

Essentially, VIIs try to maintain the oil’s viscosity at varying temperatures. They try to ensure...

What are Viscosity Index Improvers?

Viscosity Index Improvers (VIIs) are additives that help maintain the viscosity of lubricating oils across...

Understanding the oil analysis results of Diesel Engine Oil

When determining the health of your diesel engine oil, the first thing to check is...

Why Does My Diesel Engine Oil Degrade?

Several factors affect oil degradation in a diesel engine. According to The International Council on...

The Evolution of Diesel Engine oil CK4 vs FA4

CK4 oils provide enhanced protection against oil oxidation and viscosity loss caused by shear and...

What Happens When Defoamants, Dispersants & Detergents Are Used Up?

For the three additives we spoke about earlier, each of them is sacrificial in one...

Do Detergents Really Clean?

Traditionally, detergents were given their name as it was assumed that they provided cleaning properties...

Why Are Dispersants Important?

Quite often, detergents and dispersants are grouped together mainly because their functions can complement each...

Are Defoamants Necessary?

Defoamants, also called antifoam additives, are found in many oils. Most oils need to keep...

Defoamants, Dispersants, and Detergents in Lubricants – What’s the Difference?

Additives can enhance, suppress, or add new properties to oils. Defoamants, dispersants, and detergents are...

How Do Lubricant Additives Work?

Each additive works differently to produce its function on the base oil and the overall...

What are the types of Lubricant Additives?

There are many types of lubricant additives, and various formulations exist from different suppliers. In...

Why Do We Need Lubricant Additives?

Lubricants keep the world turning. Once something moves, a lubricant should be present to reduce...

What is the Difference Between Antiwear and Extreme Pressure Additives?

The terms antiwear additives and extreme pressure additives are often used interchangeably, suggesting that they...

Types Of Antiwear Additives and How They Work

There are many types of antiwear additives, but they typically all fall under the category...

What Are Antiwear Additives?

As the name suggests, antiwear additives help to prevent wear in one way or another...

How do you Measure Oil Viscosity?

The viscosity of oil is one of its most essential characteristics. Thus, it is important...

What are the factors that affect Oil Viscosity?

Similar to the molasses and water examples above, different factors can affect the viscosity of...

What is Oil Viscosity?

Oil viscosity is the internal friction within an oil that resists its flow. It measures the...

No post found

From Measurement to Action

Start measuring the air in your system. The most useful air-in-oil measurement is not the one that produces the largest number of parameters. It is the one that supports a better engineering process.

  • Define a representative baseline.
  • Detect a meaningful deviation.
  • Interpret it together with fluid, component, and operating context.
  • Investigate the most plausible mechanism.
  • Verify whether the intervention changed the measured behavior.

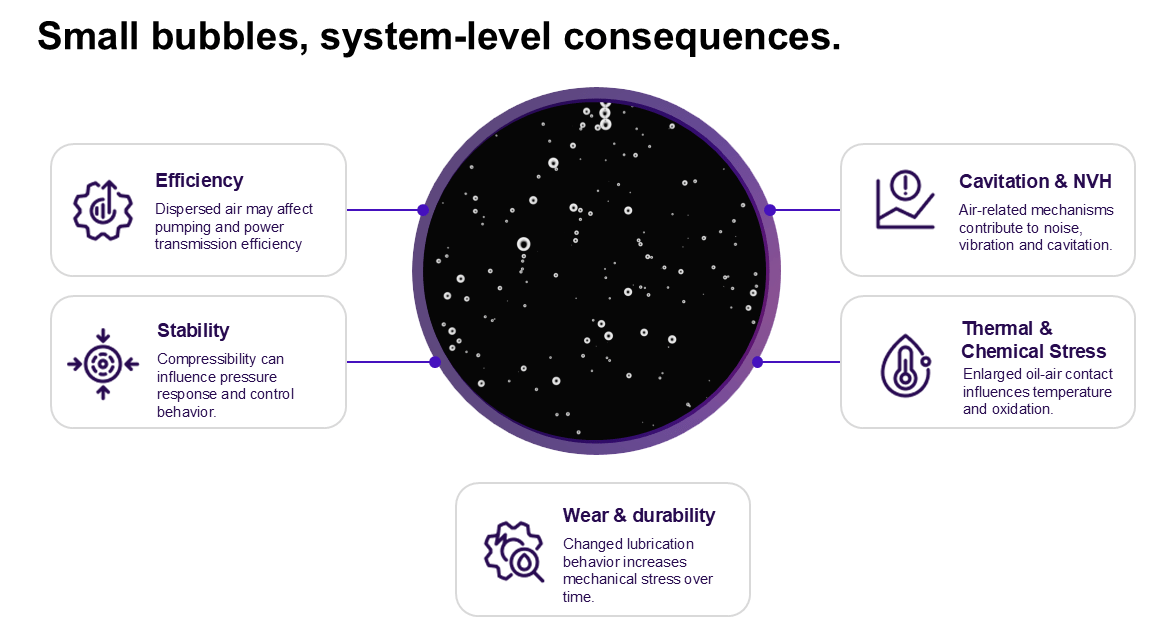
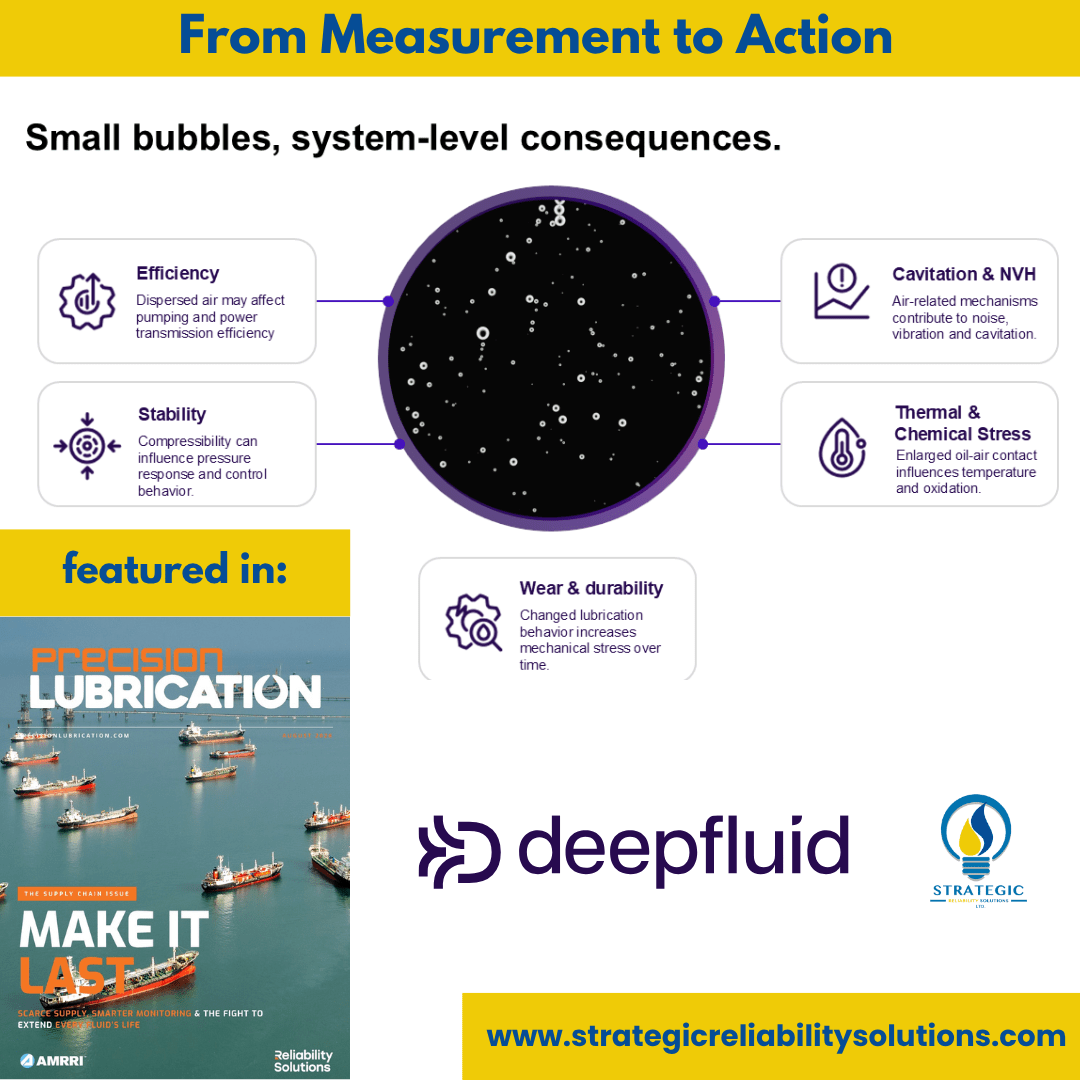
Many practitioners only view air as an issue when they see foam. By this time, it is too late and damage has already occurred to the system. Even small bubbles can have system consequences, as shown in the diagram below.

figure 6
Figure 6: System-level consequences which can be detected by the presence of small bubbles through deepfluid’s technology

Many operators are not aware of the impacts of air-in-oil and quite often, it is labelled as something else. However, it usually shows up as a foam problem, unexpected NVH, control instability, temperature problem, cavitation problem, pump problem or an oil problem. The key is to monitor these effects in different settings.

Starting with studying air release, dispersion and formulation effects under controlled conditions in the lab. Moving to the testing phase where bubble behaviour is related to operating conditions, design changes and system response. Then finally to the field where changes can be tracked over time to support root-cause analysis and confirm any improvements.

This is the benefit of using the deepfluid technology as it can capture data from the various phases to bring about actionable insights to improve the reliability of operating systems.

The 360 Approach – One Shared Data Language Across the Lubrication Value Chain

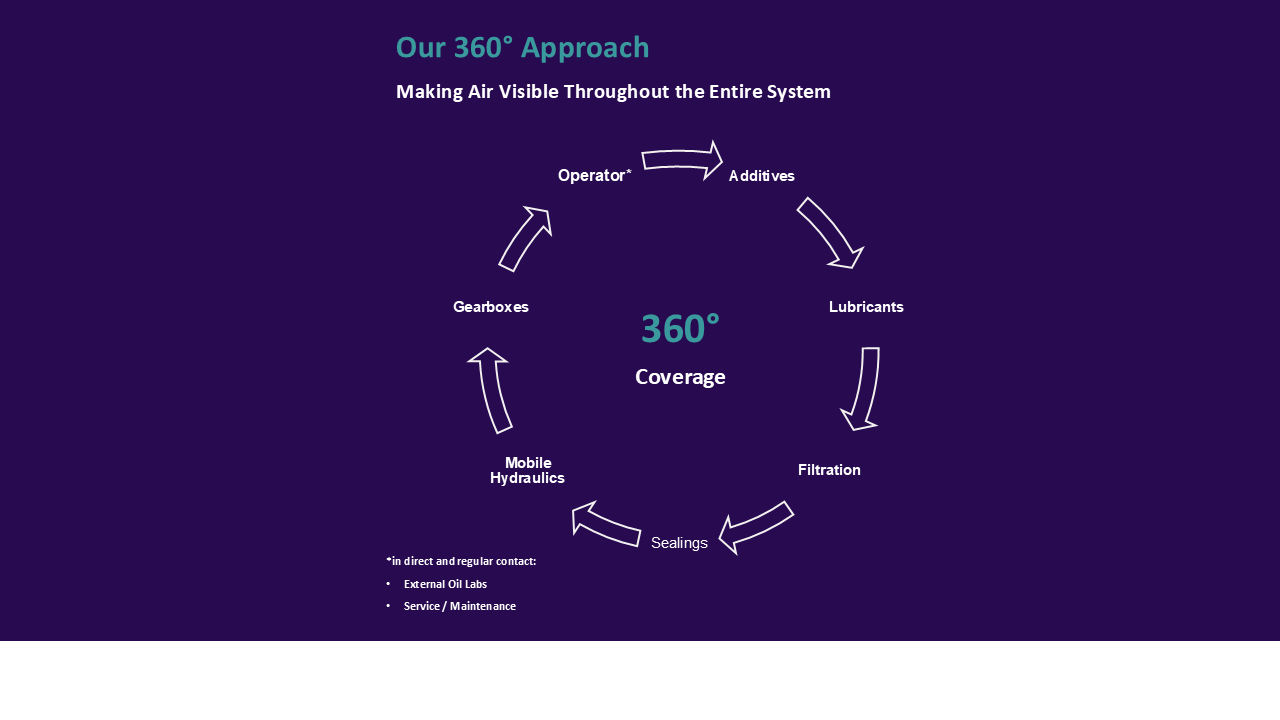
At Deepfluid, they have adopted a 360 approach where they can assist all the stakeholders involved in the lubricant industry as it relates to the oil being in the equipment. It connects formulation development, laboratory testing, component testing, system validation, field operation, maintenance, troubleshooting, and verification of corrective actions.

With the 360 approach, various stakeholders can be involved to ensure that the lubricant is fully assessed in different situations, from the testing and development of the lubricant to its actual application in the component then finally to the end user by ensuring they get the results they need.

An additive supplier may investigate formulation effects. A lubricant manufacturer may compare air-release and foam behavior. A filter or seal supplier may study aeration or air ingress. An OEM may correlate bubble behavior with efficiency, thermal management, or NVH. An operator may investigate an abnormal field deviation. An external oil laboratory or research institution may provide controlled reference analysis.

The questions differ, but the underlying air-in-oil metrics can remain comparable.

Not one product for every stakeholder, but one measurement logic that allows different stakeholders to work on the same fluid-system question from different positions in the value chain.

The 360 approach ensures that all aspects are taken into consideration for the oil, from the lab testing to the field development, with all the stakeholders involved. This guarantees that the final product is reliable and the user should have a valuable experience.

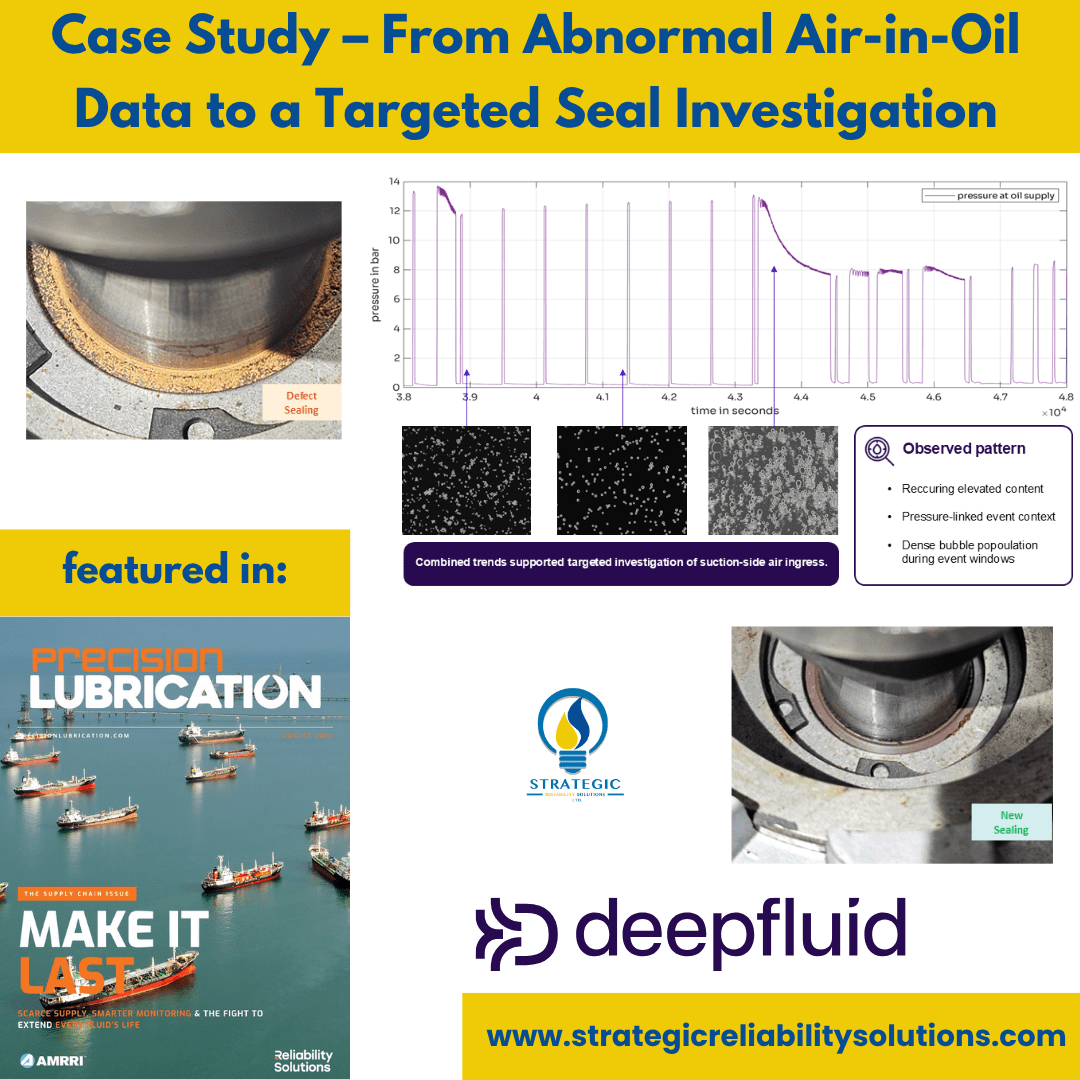
Case Study – From Abnormal Air-in-Oil Data to a Targeted Seal Investigation

Deepfluid’s direct measurement system can be used not only to analyze the interaction between oil and air during operation but also to monitor the overall system behavior and the reliability of the installed components.

The leak-tightness of hydraulic circuits is essential and critical for the safe operation of these systems. Leaks can allow air and particles to be drawn into the system under negative pressure and oil to be forced out of the system under positive pressure. The presence of air significantly alters operating behavior by changing viscosity, density, fluid level, and lubricating film thickness. These factors can lead to damage such as pitting, scuffing, and micro-dieseling.

If an operator or service technician frequently inspects an application’s oil tank—either directly or through large sight glasses—high air content can be detected by significant cloudiness in the oil.

However, if the application’s oil tank is located in a hard-to-reach position, operates autonomously, or is only accessed during shutdown, such extreme conditions are detected very late, in the laboratory—if at all—before costly damage occurs. This is the case with the operation of wind turbines. Although speed, torque, temperature, particle content, and potential oil leaks are detected, suction-side air ingress, for example, cannot be detected.

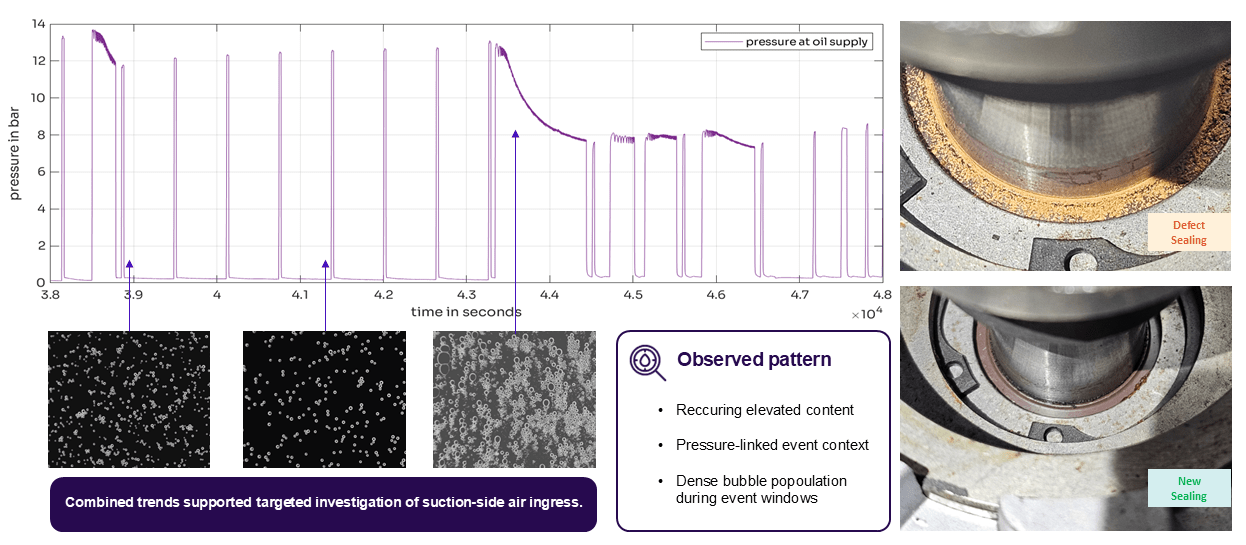
figure 5A
Figure 5A. Recurring Air-in-Oil Deviation During Gearbox Operation. A synchronized view of air content, pressure context, and bubble population illustrates how recurring events can support a targeted investigation of possible suction-side or sealing-related air ingress.

In the case study presented, a defective shaft seal was detected through direct measurement on a supply pump for the injection lubrication system of a wind turbine, based on an iteratively and periodically occurring very high air content and loud noise. A minor issue that can have serious financial consequences.

Risks posed by excessive air content and their costs, using a 2.5 MW turbine as an example:

  • Higher operating temperature, which requires additional cooling
  • Increased cooling capacity (between 4.9 kW and 9.4 kW) due to reduced thermal conductivity (0.14 W/(mK) → 0.125 W/(mK)), costing between 7k€ and 10k€ per year
  • Change in friction conditions in conjunction with increased cooling capacity: 43k€–82k€ per year
  • Risk of faster oil aging due to accelerated oil oxidation and thermal oil oxidation: 1 additional oil change (24k€–60k€)
  • Total mechanical failure of the main gearbox renders the entire system uneconomical.

In this component, there was persistently high air content which we are able to identify and link to abnormal ingress of air into the lubrication system. However, we also saw the pressure drop during pump operation. This was an indicator for suction-side or sealing-related air ingress. We also noticed a dense bubble population which indicates critical oil-air dispersion under operating conditions. There was a deviation from a similar gearbox indicating that this was a system-specific malfunction rather than normal behaviour.

If these were not identified at this early stage, the equipment would run the risk of micro-dieseling, cavitation, oxidation and temperature increase. This would lead to mechanical damage in the gearbox or oil supply components, eventually leading to reduced lubrication reliability and accelerated wear.

One Portfolio for Controlled and Dynamic Evidence

The Deepfluid portfolio applies this methodology through three connected solutions.


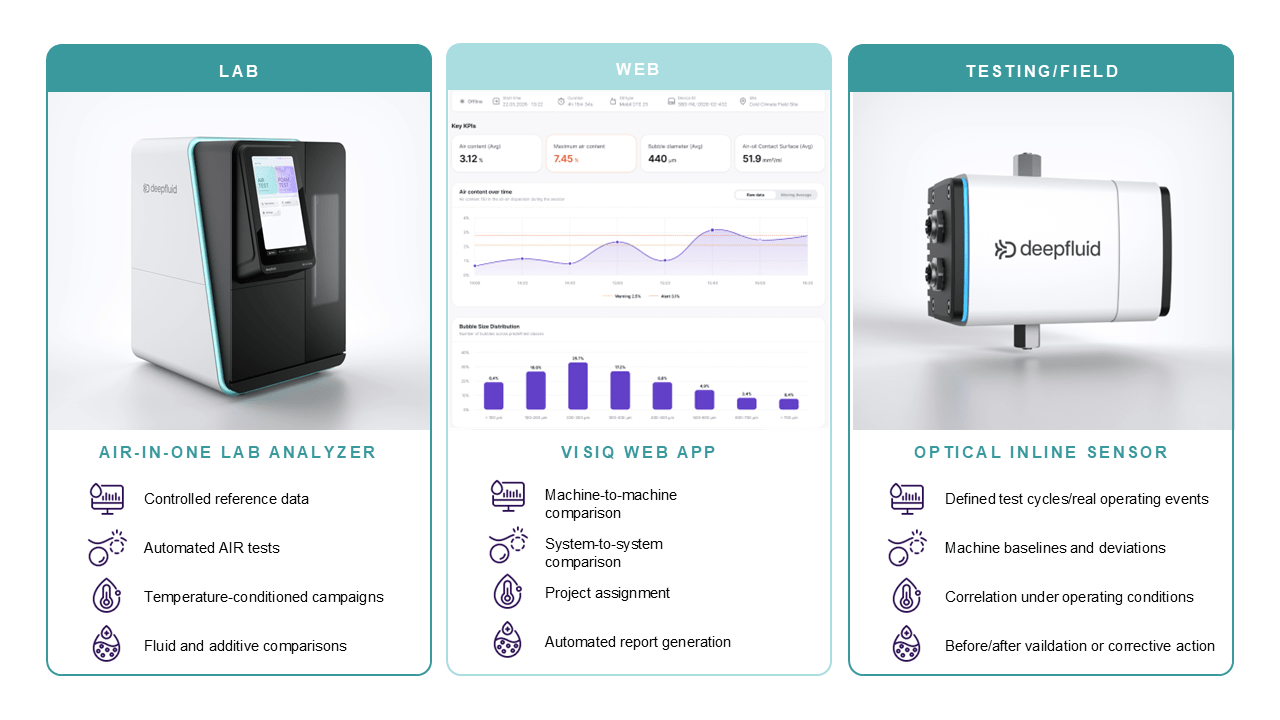
The Air-in-One Lab Analyzer establishes controlled references.

The Optical Inline Sensor captures dynamic behavior.

visiQ connects both into a comparable engineering process.


figure 4
Figure 4. One Measurement Logic from Lab to Field. From Lab to Field does not mean that laboratory, test-rig, and operating conditions are identical. It means that the same Air Intake, Retention, and Release logic—and the same bubble-level metrics—can be applied across different environments and compared within one engineering workflow.

Deepfluid Air-in-One Lab Analyzer

The Deepfluid Air-in-One Lab Analyzer combines air release, foam, and time-resolved bubble behavior within one integrated and automated workflow.

Defined aeration, fluid handling, automated temperature conditioning, optical measurement, foam observation, data transfer, and cleaning can be connected into repeatable test sequences. A fully automated AIR test can capture the complete progression from baseline through Air Intake and Retention to Air Release.

Throughout this sequence, the system measures the physical development of the oil-air dispersion rather than only recording a final release time or foam volume, including Air Content, Bubble Size and Bubble Size Distribution, Bubble Count and Bubble Population, Oil-Air Interfacial Area, and time-resolved Intake, Retention, and Release behavior.

The Air-in-One Lab Analyzer also supports automated test campaigns. Lubricant and additive developers can compare fluid candidates, formulation variants, additive packages, antifoam concentrations, temperature profiles, or aeration durations using the same test logic and evaluation structure.

This makes it possible to investigate not only whether a fluid meets a defined air-release or foam specification, but also why different formulations produce different Air Intake, Retention, Release, and foam responses. Engineers can examine how the bubble population develops before visible foam forms, how much air remains dispersed after aeration stops, and how temperature or formulation changes influence the subsequent recovery.

The approach is not intended to replace standardized ISO or ASTM air-release or foam tests. These methods remain essential for reproducible specification checks and lubricant qualification. The Air-in-One Lab Analyzer adds a complementary, process-aligned R&D perspective that goes beyond a single pass/fail value.

It enables lubricant developers, test engineers, and technical decision-makers to investigate the mechanisms behind Air-in-Oil behavior, compare formulations under application-related conditions, and develop a more complete understanding of Air-in-Oil Contamination before it becomes a field troubleshooting issue.

Standardized tests confirm whether a requirement is met. The AIR workflow helps engineers understand how the result develops—and how that behavior translates from Lab to Field. It is not a replacement for the standardized tests but rather a tool to understand Air-in-Oil Contamination from an R&D perspective.

Deepfluid Optical Inline Sensor

The Deepfluid Optical Inline Sensor transfers the AIR Framework into dynamic test and operating environments.

Instead of recording only a single air-content value, it can capture complete Intake, Retention, and Release behavior over defined time windows. Engineers can observe when a bubble population begins to form, how rapidly it develops, which size classes dominate, how much air remains dispersed after the operating state changes, and how quickly the system returns toward its baseline.

This adds a time-resolved view of transient events. A load change, speed ramp, thermal transition, pressure drop, component-switching event, or start-stop cycle can be evaluated as a complete AIR sequence rather than as an isolated data point.

The sensor can be used in representative inline or bypass configurations, subject to application-specific review. All device configurations have also been developed for demanding high-pressure applications above 150 bar.

When bubble-level data are combined with temperature, pressure, speed, load, flow, efficiency, vibration, or noise, the measurement supports direct comparison between fluids, components, machine variants, and operating conditions. It can also be used to verify whether a design change or corrective action altered the measured Air Intake, Retention, or Release behavior.

The sensor does not automatically diagnose a root cause. It records how the dispersed air phase responds to a defined event, operating state, or intervention and provides evidence for a more focused engineering assessment.

visiQ by Deepfluid

visiQ by Deepfluid provides the common comparison and reporting layer.

Devices and measurement sessions can be assigned to projects, enabling structured data management across development programs, test campaigns, and field investigations. Evidence Snapshots remain linked to the corresponding measurement points and operating context.

The platform supports machine-to-machine, system-to-system, component-to-component, fluid and formulation, and before-and-after comparisons.

For example, the same machine and lubricant can be evaluated under different ambient conditions or load cycles. Conversely, different components can be compared under the same operating profile, or similar machines can be benchmarked across locations. This helps engineering teams distinguish more systematically between fluid-related, component-related, system-related, and environment-related differences.

visiQ also supports automated reporting, reducing the effort required to compile recurring test results, before-and-after comparisons, and structured project summaries.

One Shared Data Language – From Lab to Field

Particularly for OEMs, it is important to be able to transition the product from the lab to the testing phase, then into the field. In the lab, they can control the operating conditions, study the air intake and release, dispersion and formulation effects. Afterwards, they can relate bubble behaviour to operating conditions, design changes and system response. Finally, they can execute in the field and track the changes over time to support any root cause analysis for the future and confirm improvements. This is a movement from controlled conditions in the lab to dynamic conditions in testing to finally real-world conditions in the field.

Typically, conventional sensors will give parameters such as a change in dielectricity, a foam tendency, some noise or vibration and an oil condition change just as a result, without knowing the root cause. However, with Deepfluid, they are able to actually make physical behaviour visible and directly explainable. The size and shape of a bubble can be seen, classified and quantified. This allows for the actual oil-air contact surface area to be determined, and this can be trended over time to establish patterns.

What Recurring Patterns Can Bubble-Level Data Reveal?

Direct optical measurement does not identify a root cause on its own. Its practical value lies in revealing repeatable physical patterns that can be compared with operating conditions, representative baselines, and similar systems.

Examples include:

  • An increasing population of small bubbles under steady load may be consistent with continuous air ingress or churning.
  • Recurring air-content spikes synchronized with pump starts, pressure drops, or speed changes may point to an event-related source of Air Intake.
  • A shift toward larger bubbles following a load or pressure transition may reflect bubble expansion, coalescence, or the beginning of Air Release.
  • A slow return to baseline after an operating event indicates that air remains retained in the fluid-system combination or is released only gradually.
  • Similar Air Content with different bubble-size distributions, bubble counts, or oil-air interfacial areas shows that the physical state of the dispersion is not necessarily the same.
  • Different AIR profiles under comparable operating conditions can help distinguish normal system behavior from a machine-, component-, or environment-specific deviation.

Before-and-after measurements add another practical dimension. By repeating the same operating cycle after a change to a seal, reservoir, component, fluid, or control strategy, engineers can verify whether the intervention altered Air Intake, Retention, or Release behavior.

These observations should be treated as investigation signals rather than automatic diagnoses. Their meaning becomes clearer when bubble-level evidence is evaluated together with pressure, temperature, load, speed, flow, vibration, noise, and a representative baseline.

AIR as a Practical Lab-to-Field Framework

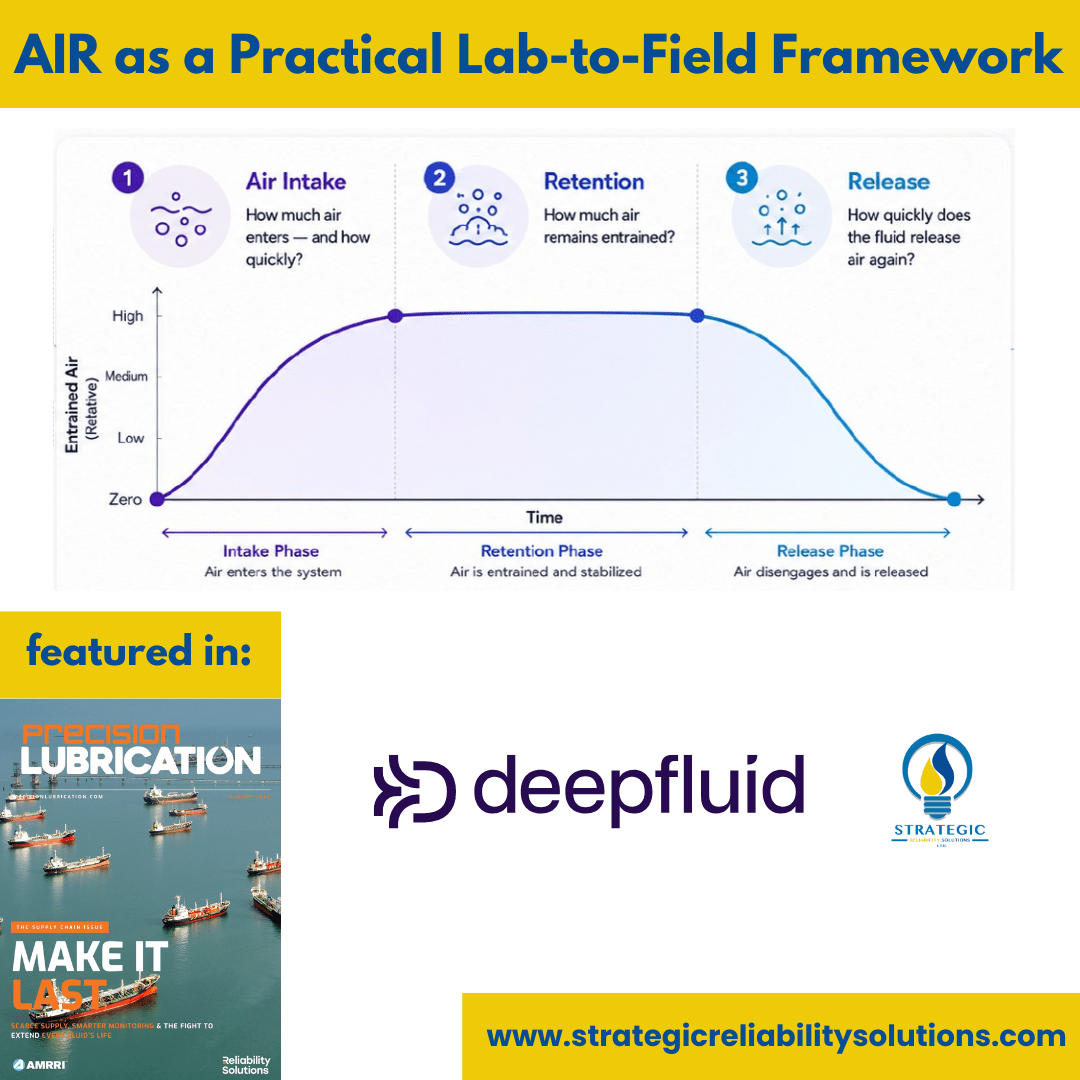
The Deepfluid AIR Framework turns insights from bubble-level evidence into three entirely new practical engineering questions and metrics:

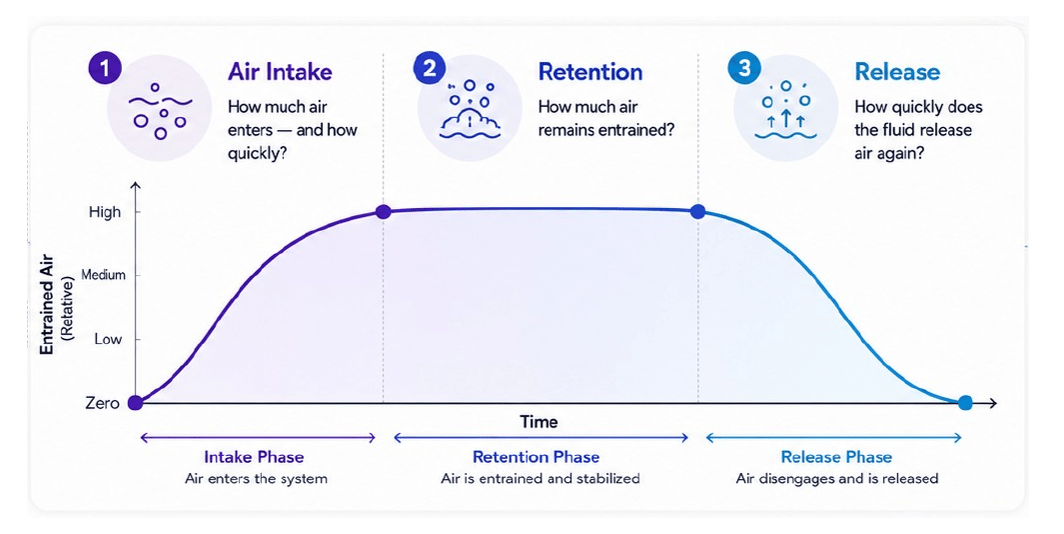
1 Air Intake

Air Intake describes not only how quickly air enters the fluid system and under what conditions it is generated or introduced, but also how much air the oil can actually absorb over a specific period of time.

2 Air Retention

Air Retention describes how much air remains dispersed, how long it remains in the system, and how the bubble population changes.

3 Air Release

Air Release describes how quickly and completely the fluid-system combination returns toward its baseline after aeration or an operating-state change. By having the Air Intake value, Deepfluid addresses a new question that has not yet been covered by conventional air release laboratory tests: “At what initial air content by volume does my air-release measurement actually begin?”

AIR is not an abstract research model. It is a practical structure for planning tests, defining measurement windows, comparing fluids, evaluating component and design variants, analyzing operating states, and verifying corrective actions.

figure 3
Figure 3. The AIR Framework: Intake, Retention, and Release. The AIR Framework structures air-in-oil behavior as a time-resolved sequence. In controlled testing, aeration duration, temperature conditioning, measurement intervals, and recovery phases can be defined; the same logic can be applied to operating events in testing and field environments.

In the laboratory, air release no longer has to be viewed only as a single endpoint under one fixed condition. Individually defined aeration durations, automated temperature conditioning, and time-resolved optical measurement make it possible to run a fully automated AIR test.

Such a sequence can establish a bubble-level baseline before aeration, follow the bubble population during a defined Air Intake phase, quantify Air Retention after the air supply stops, and measure the Air Release curve over time. The same workflow can connect air content, bubble-size distribution, and bubble-population dynamics with subsequent foam formation and foam decay.

This makes it possible to compare different fluids, additive concentrations, temperatures, or aeration durations within structured, automated test campaigns. The laboratory therefore moves closer to application-related questions without giving up controlled and repeatable conditions.

In testing and field operation, the same AIR logic can be applied to defined operating windows. A cycle may begin at a stable baseline, follow an increase in air content during a load, speed, pressure, or temperature change, quantify how much air remains dispersed, and measure recovery afterward.

The resulting bubble-level metrics can be related to operating data such as temperature, pressure, speed, load, flow, efficiency, vibration, or noise.

The conditions are not identical across lab, testing, and field environments but the measurement logic is.

AIR turns air release from a single laboratory result into a practical understanding of the full cycle around how air enters, remains, and leaves a fluid system.

How Air in Oil gets Measured

Typically, oil condition monitoring is performed through standardized laboratory tests at specified intervals. A representative sample is taken on-site from the system being monitored and analyzed in the laboratory under controlled conditions. This allows for a detailed analysis of numerous parameters that reflect the condition of the oil, such as viscosity, density, and air release behaviour in accordance with DIN ISO 9120.

However, when the sample is pulled from the equipment, it must travel some distance to the lab. During this transit, the oil sample may lose some characteristics that defined the system in which it was operating. While this does not corrode the integrity of the sample, it may not define an accurate representation of system conditions.

In the laboratory, it is not possible to correlate the oil’s interaction with the system’s behavior, which is characterized by constantly changing process conditions such as pressure, temperature, flow rates and air-contents. As these process conditions change, the measurable properties of the oil also change proportionally, and these properties directly determine the efficiency and service life of both the system and the oil. Comprehensive monitoring of the system’s condition can therefore only be achieved through laboratory analysis in conjunction with field measurements.

This approach allows for direct measurement of how the oil interacts with the equipment and generates data points that were previously unthinkable. This enables operators to make predictions that can extend the service life of the oils and make plant operations more efficient or less prone to errors.


What Gets Measured

It is well known that, during the operation of hydraulic systems and transmissions, air is inevitably though unintentionally mixed into the oil. The air content alters the oil’s properties by creating a multiphase mixture, thereby influencing measurable operating parameters in both the short term (efficiency, NVH, temperature) and the long term (oxidation, additive depletion, oil aging).

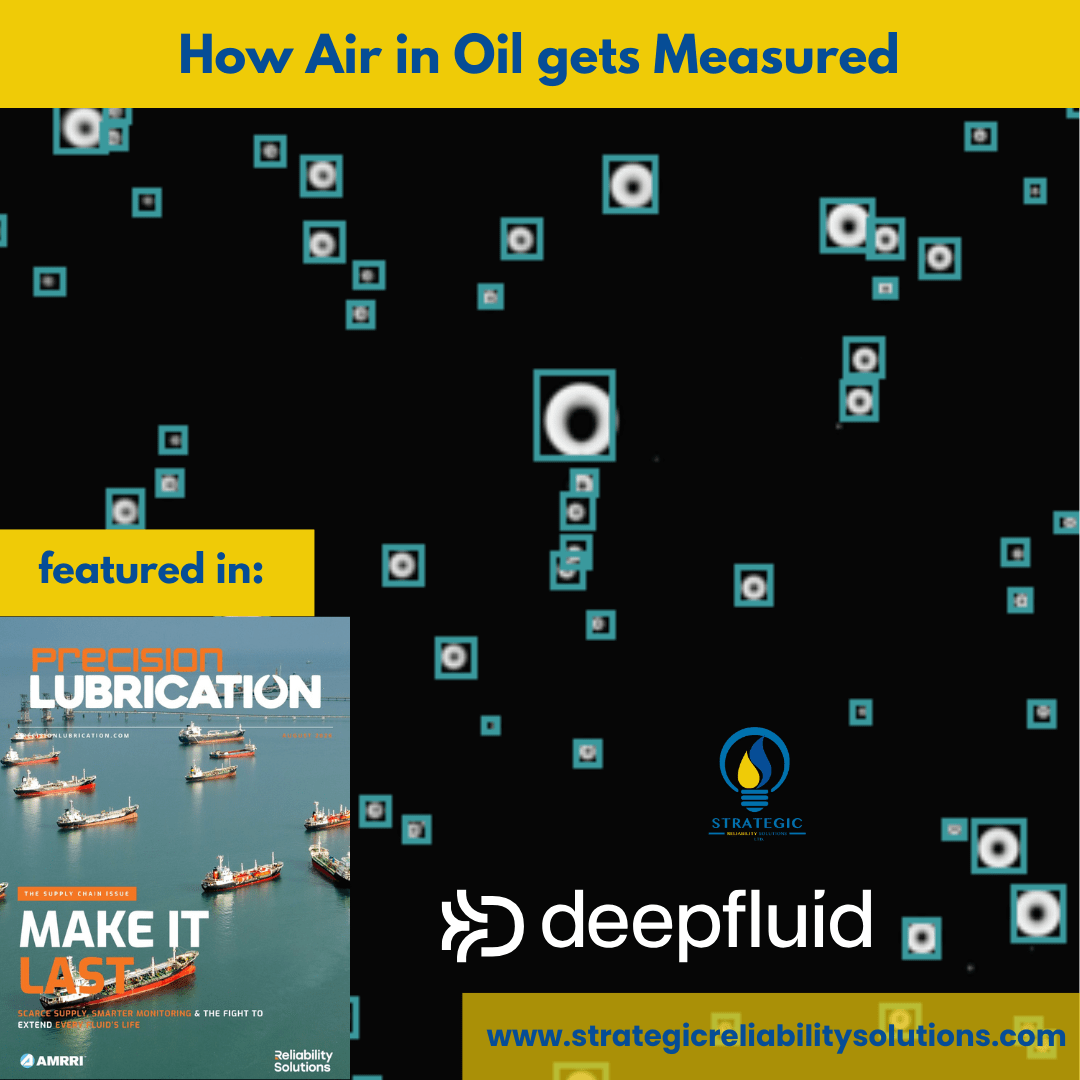
The Deepfluid bubble profiling technology combines an intelligent vision module and an intelligent LED system. This captures real-time images of the fluid as it flows through the device. Through the use of computer vision-based image processing, each air bubble is identified, sized and classified on a continuous basis. This allows trends and patterns to be recognized and established. No on-line calibration and constant re-calibration is required for this equipment, and it can work across various types of oils with different viscosity ranges and colors or aging-states.

The Deepfluid optical approach evaluates bubbles within a defined size range of 8 to 500 micrometers and generates time-resolved information such as:

  • air content,
  • bubble-size distribution,
  • bubble count,
  • bubble-population dynamics,
  • oil-air contact surface / interfacial area, and
  • transient air events.
figure 1
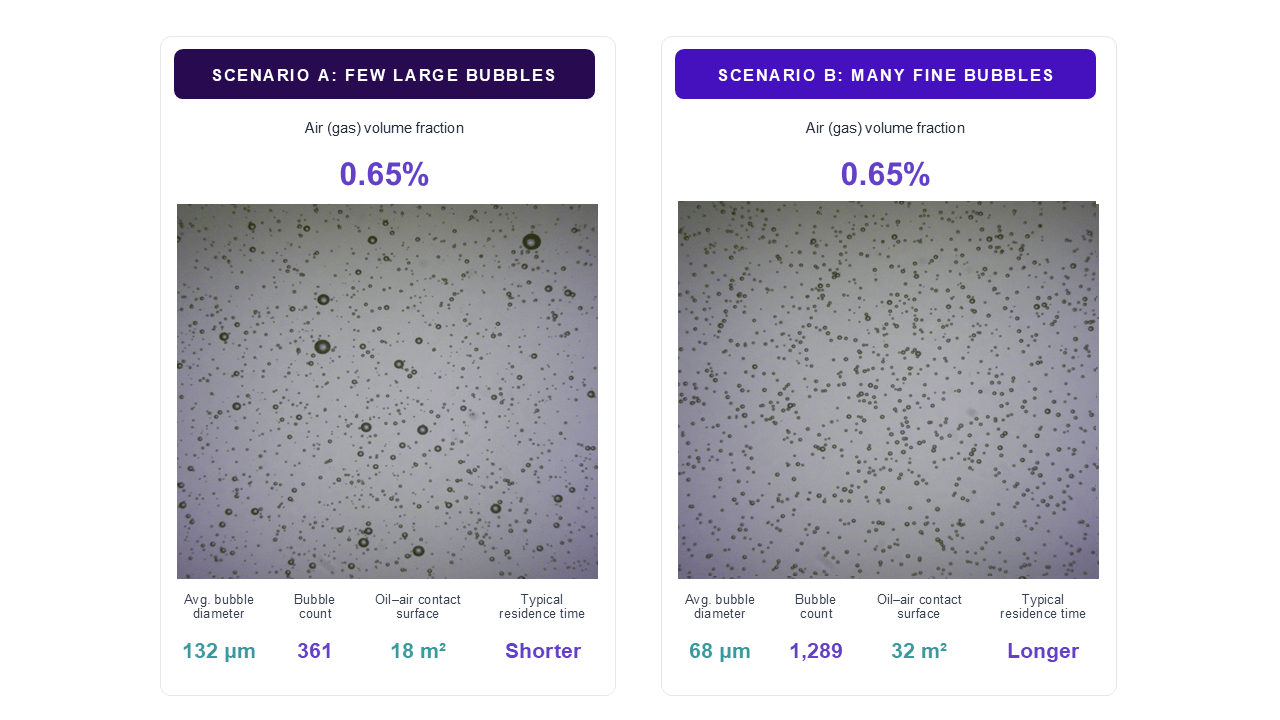
Figure 1. Same Air Content. Different Bubble Behavior. Two fluid states can show the same volumetric air content while differing in bubble-size distribution, bubble count, oil-air interfacial area, and release tendency. Air content alone does not fully describe an oil-air dispersion.

Until now, measuring air content has been possible primarily through indirect analytical methods. In this approach, the conductivity of the oil, excluding air content, was referenced to the conductivity of the oil-air mixture during operation. This allows for the analysis of air content percentages under constant conditions. The biggest problem with this measurement is the change in the oil during continuous operation of the system, since water content, particle content, temperature, and additive content are constantly changing, making continuous measurement during operation impossible.

As shown above in Figure 1, the traditional method of measuring the air volume does not accurately depict what is happening in the oil. The air volume of 0.65% only measures one aspect of the oil. With the direct measurement by Deepfluid, users can get deeper insights and explore another dimension of oil condition monitoring by measuring the bubble diameters during operation and compare it with the same technology in a lab-based air-in-oil analysis. Based on this information, short term behaviour (density change, viscosity change, lubricant film thickness, Air-Intake, Air-Release-Behaviour, thermal conductivity and NVH) as well as long term response (oxidation, additive depletion, mechanical robustness, risk of pitting) can be detected and their respective influence targeted.

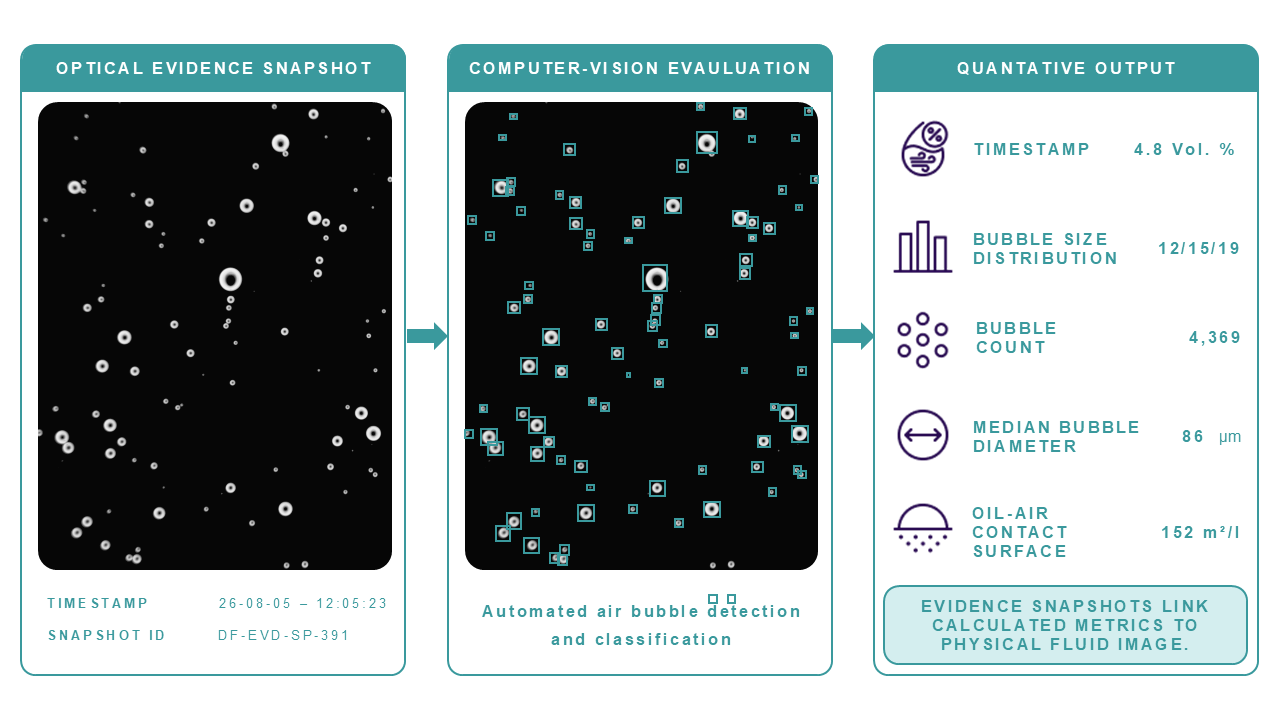
A key feature is the availability of so-called Evidence Snapshots. Each calculated measurement point can be linked to an optical image of the fluid at that moment. Engineers can review the underlying image, verify the detected bubble population, and relate an unusual value to the physical condition on which it is based.

This creates point-level traceability between the calculated metric and the visible evidence.

Evidence Snapshots do not replace numerical specifications for repeatability, accuracy, or measurement uncertainty. They add transparent verification and support more informed technical discussion between lubricant developers, test engineers, component specialists, and reliability teams.

figure 2
Figure 2. From Optical Evidence to Quantitative Bubble-Level Data. Direct optical measurement links calculated air-in-oil metrics to the underlying fluid image. Evidence Snapshots provide point-level traceability between air content, bubble-population data, and the recorded physical condition.

The optical approach has also been demonstrated with visually challenging fluids, including dark, aged, and soot-loaded engine oil. As with any optical method, application limits must be understood. However, Deepfluid’s bubble-level analysis is not restricted to transparent new oils.

The objective is not to replace conventional oil analysis, pressure, temperature, vibration, or standardized air-release and foam testing. It is to add direct evidence about the dispersed air phase and its dynamics.

Turning Air Measurements Into Reliability Insight

The Smart Bubble System, developed by Evamo, allows users to gain deeper insight into the behavior of air in their oil. It turns a general volume-based quantification into actionable metrics to improve your system’s reliability and performance. The SBS captures the following metrics:

  • Bubble diameter
  • Air content in your system
  • Bubble count
  • Bubble size-distribution
  • Oil-Air contact surface
  • Transient bubble events

These metrics are directly related to what users see in the field. As such, it closes a gap that many users often experience when relating lab results to field integrations. Users can also trend whether the number of smaller bubbles increased, whether large bubbles began to form in their system, or whether there were transient spikes due to particular conditions in temperature, load, speed, or even return-flow conditions.

Here are a couple of examples that highlight how these values can be interpreted in the field:

  1. If a rise in fine-dispersed bubbles occurs, then this can be indicative of persistent gas transport through the system. This affects the oil’s compressibility and can even lead to a stability issue.
  2. If there is a rise in the number of larger bubbles, this can indicate that there is localized entrainment, return-line impact, free-surface interaction, and stronger ingestion events. If these are not addressed in time, they can damage your components.
  3. If one detects an increase in oil-air contact surface, this can indicate that gas distribution has become more degradation-relevant in the system. This may be despite no dramatic change in the total air content.
  4. If transient bubble events are present, this can directly point to issues related to specific operating states rather than a general system condition that needs to be addressed.
  5. If smaller bubbles occur, this leads to much worse thermal conductivity. As such, higher operating temperatures would need to be cooled down directly with a high amount of energy, or this can lead to a much higher thermal oxidation rate. In each case, the system efficiency is reduced.

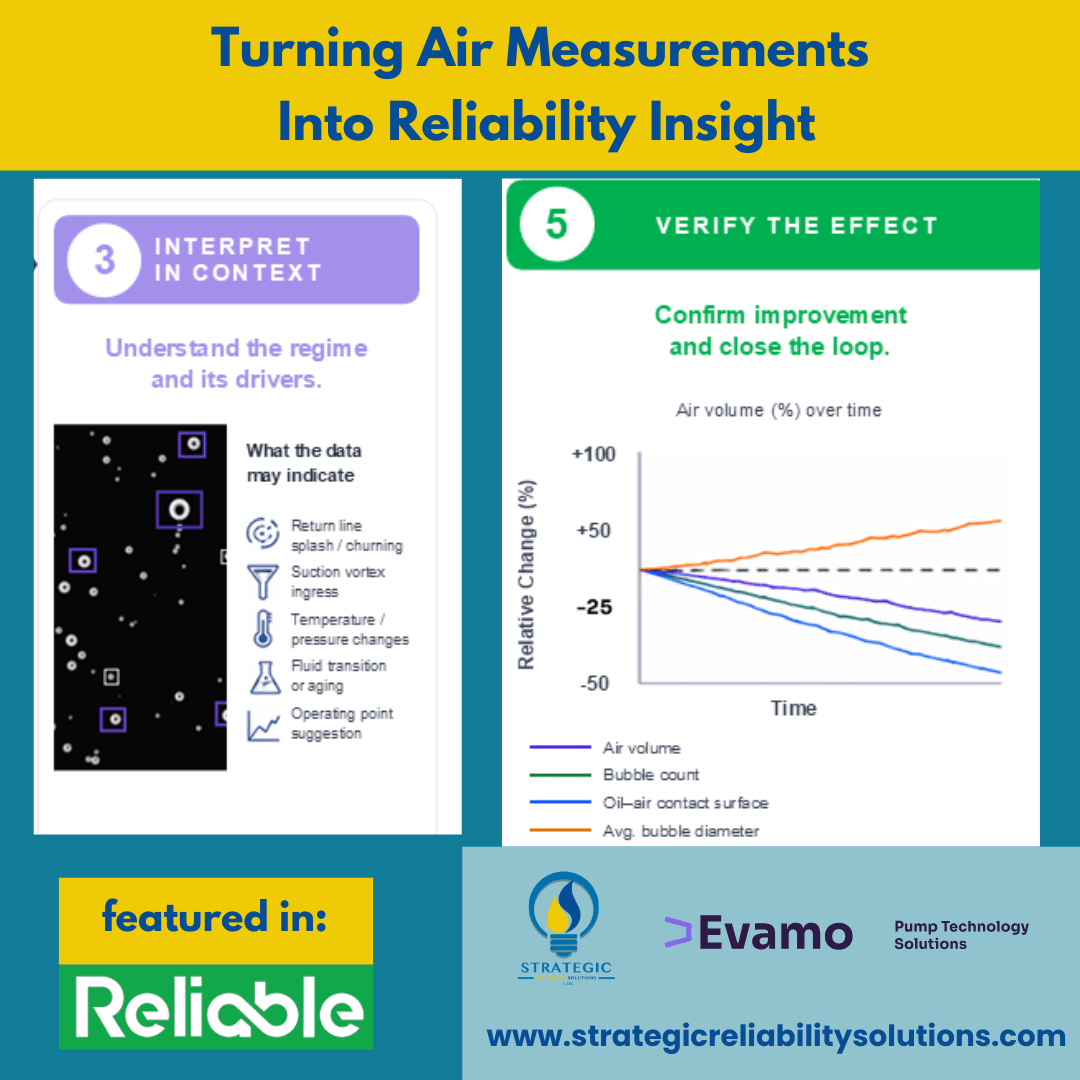
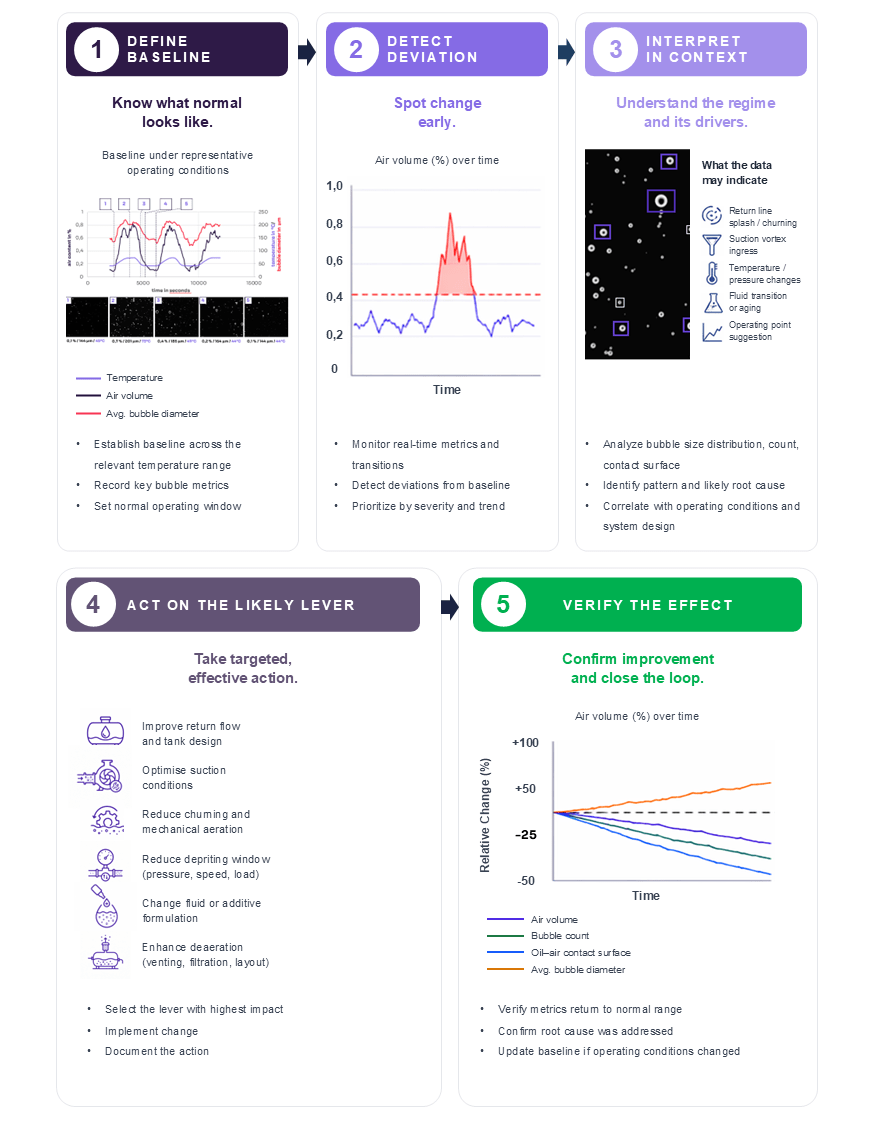
These observations set the stage for more in-depth analysis and contextual interpretation to determine whether the pattern is fluid-driven, hardware-driven, or operating-point-driven. A workflow can be easily implemented to reduce risks to your operation, as highlighted in Figure 3 below.

Figure 3: Suggested workflow for monitoring air in your oil

A robust methodology for the characterization and optimization of your system should follow a structured measurement and interpretation workflow:

  1. Definition of the System Baseline
    The first step is to establish a representative baseline condition by continuously measuring the system’s actual operating state. These parameters should include temperature, rotational speed, torque, flow velocity, pressure conditions, and load states. The baseline must capture the dependency of the oil–air behavior on these operating variables to provide a reliable reference for subsequent evaluations and further steps.
  2. Detection of Deviations and Dynamic Transitions
    Deviations from the baseline are identified using real-time monitoring metrics and transient analysis. Changes in aeration behavior, bubble content, or flow characteristics are quantified relative to the reference baseline state established in Step 1. In parallel, a prioritization strategy should be defined to identify the most critical deviations and focus optimization efforts on the parameters with the highest system impact.
  3. Contextual Interpretation of Deviations
    Detected deviations must be interpreted within the system’s physical context. The origin of the observed behavior should be determined by correlating the measured size distribution and temporal system response with potential mechanisms such as splashing, churning, vortex formation, temperature variations, fluid aging, or changes in the operating point. This contextual analysis enables the differentiation between transient operational effects and systematic design-related issues.
  4. Implementation of Targeted Corrective Measures
    Based on the contextual interpretation, focused and goal-oriented design modifications can be implemented. Possible optimization measures include adjustments to return-flow geometries, improvements in suction conditions, reductions in churning effects, optimization of pressure levels, speed or load adaptations, fluid conditioning, changes to additive formulations, or enhanced filtration strategies. The corrective actions should directly address the identified root causes of the aeration behavior.
  5. Validation Through Continuous Measurement and Improvement
    The effectiveness of the implemented measures must be validated through continuous monitoring and iterative evaluation. Repeated measurements under comparable operating conditions ensure that improvements are sustainable and quantifiable. This closed-loop approach enables continuous system refinement and supports long-term optimization of the behavior of oil–air mixtures.

By moving beyond the standard quantitative measure of air in oil, we can address critical issues occurring in our equipment.  By measuring and interpreting metrics correctly, you can optimize your system’s overall performance, make it goal-oriented, and keep it focused. This supersedes the often-used trial-and-error approach, which can ultimately damage your equipment.

For those interested in taking a more serious approach to understanding the health of their oil and preventing issues before they occur, the SBS can help improve the reliability of their system.

What you see is what you get!

How Is Air in Oil Measured?

When we think about measuring air in oil, the top-of-mind lab tests that are well known are the foam test (ASTM D892) and the Air Release test (ASTM D3427 & DIN ISO 9120). While these two tests can provide information on the tendency of foam to dissipate or for air to be released from the oil, they don’t give the entire story of what’s happening in the oil as it relates to air.

More specifically, they do not take into account the volume of air that can be trapped in your system during operation, nor how long it will take to dissipate when everything stands still. These parameters are critical for determining the impact of entrapped air in your oil.

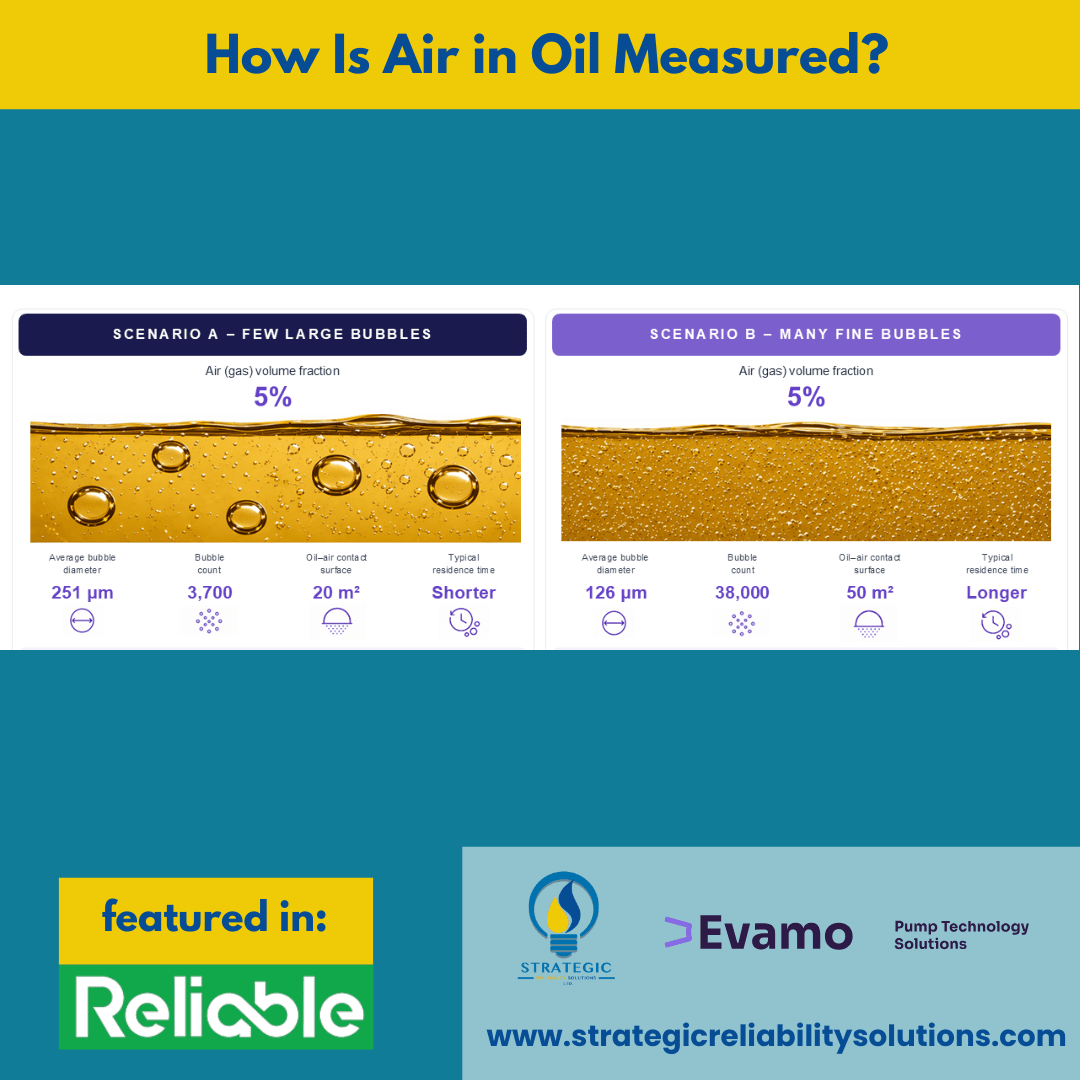
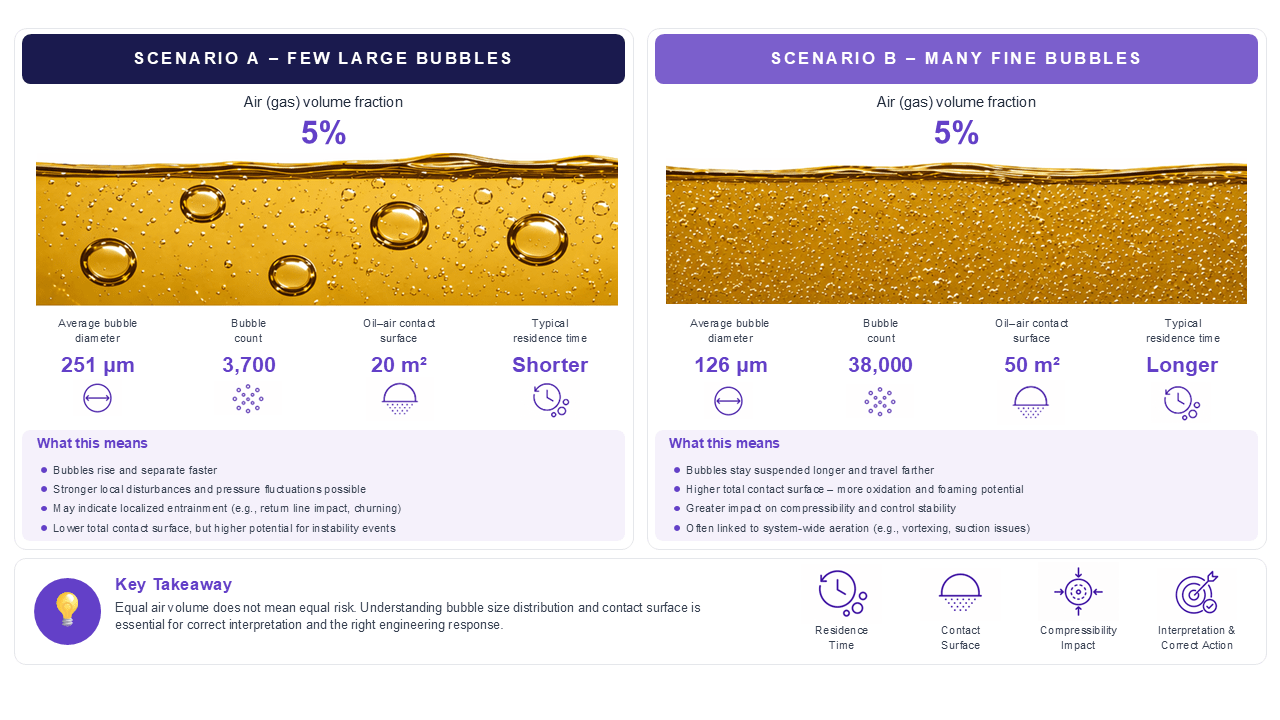
People can also measure the volume of air in the oil, but 5% can mean different things depending on the air’s state, as shown in Figure 2 below.

Figure 2: Scenarios where the air (gas) volume of 5% can mean different things

As we can see in Figure 2, an air (gas) volume fraction of 5% may appear the same, but it can affect your system differently.

In Scenario A, the bubble sizes are larger, so these will rise to the surface more quickly and dissipate. As such, there are fewer disturbances and pressure fluctuations.

In this case, these might indicate localized entrainment, suggesting churning or impact from your return line. Another source could be coalescence, driven by oil properties, splash effects, and other factors. The risk of air bubbles becoming trapped in dead zones increases.
However, in Scenario B, the average bubble size is smaller, which means there are many more air bubbles in the oil! This means that there is a higher surface contact area and an increased potential for foaming. This can increase the rate of oxidation and, by extension, the risk of the oil forming varnish.

This also significantly affects the oil’s compressibility. With the advent of these smaller bubbles, there is usually system-wide aeration, such as vortexing or suction issues. The risk of inefficient cooling and overheating your oil in heaters has increased significantly.
With only a 5% air volume result, we would be missing critical information, such as what could be causing the issue or whether it is an immediate threat to our operations. This is where the SBS (Smart Bubble System) changes the entire game.

The Chemistry Behind Air in Oil

The oil’s chemistry also plays a significant role in determining its air content. All finished lubricants consist of base oil and additives. The characteristics of your base oil can determine important factors such as your viscosity, interfacial behavior, density, and gas solubility. The surface tension of your oil can also be affected by the size of the bubbles and how long they stay in that formation of the bubble.

Depending on the oil application, the appropriate ratios and types of additives vary. As such, there may be more emphasis on certain characteristics such as oxidation stability, viscosity behavior, or foam control. These additives all affect how long air can remain in the oil and the oil’s state, which can affect our machinery.

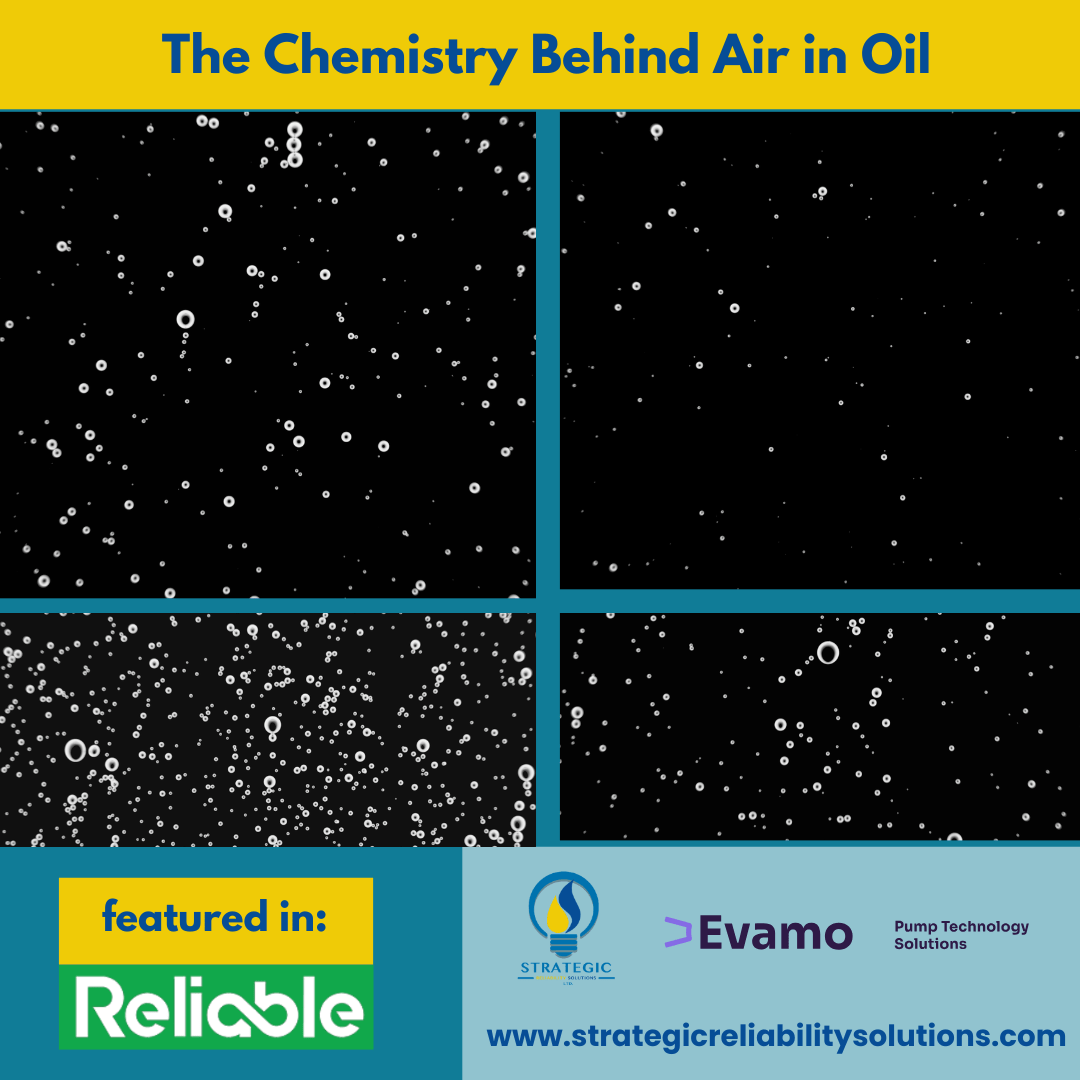
As shown in the video below, we can compare the air content percentage of an oil at varying temperatures and observe significant differences.

As shown in the first video, for a wind turbine gearbox using Optigear Syn CT320, the oil contains less air as the temperature increases, decreasing from 2% at 80°C to 0.7% at 110°C. At 110°C, we see a further decrease in air content to 0.65%. As the temperature starts decreasing again toward 80°C, we observe a volume with 2.2% air content in the oil. This is simply due to a temperature change in the oil, not to any additional air ingress.

As such, for the Optigear Syn CT320 oil in this wind turbine gearbox application, we can conclude that if the oil operates at temperatures around 80°C, we can expect up to 2% air volume in the oil. We observe that for lower temperatures, the air content may increase due to the impact of viscosity on air-release capability.

But if the temperatures increase (to a temperature that is tolerated within the system), then the volume of air will decrease, which is a good thing. However, as temperature increases, your chances of thermal and non-thermal oxidation also increase.

In the video above, we see a completely different behavior with the Fuchs Titan EG ATF D VI oil in an automotive gearbox, which starts off at 45 °C. There is a low air volume in the oil at 0.1%. However, when the temperature reaches 73°C, the volume of air increases by 0.7%.

The air bubbles are much larger, increasing the contact surface and their count within the oil. As the temperature decreases to 49°C, the volume decreases by 0.4%, and the number of bubbles decreases. With the continued drop in temperature to 44°C, the air volume decreases to 0.2% and then tapers off to 0.1%, with smaller, fewer bubbles.

In a wind turbine gearbox application using industrial gearbox oil, we observe that the air content decreases as temperature increases. Conversely, in an automotive gearbox using transmission gear oil, the air content increases with rising temperatures. This is very specific to the oils tested in these examples, as different oils will have varying ratios and types of additives and base oils, which can be affected in diverse ways.

The chemistry of the oil is, therefore, another critical part of understanding the air in your oil. If this is properly understood and measured, it can be very useful for monitoring your oil’s health in the field.