Tagged: root cause analysis

How to identify the Root Causes of ESD in Lubrication

Thus far, all the prevention methods have focused on the physical roots of ESD. We did not explore some of the human or systemic roots that are also accountable for ESD. In this section, we will develop a logic tree designed to address a critical failure occurring in a plant. This will be used as an example of the logic tree, which can be developed when investigating the root causes of ESD.

Let’s start with the top of the logic tree, where we define the event or the reason we care. In this situation, it is an unplanned shutdown for 4 hours. An unplanned shutdown will impact the plant’s production, which is why we care about conducting this investigation.

We will assume that the failure mode occurred on one of the critical pumps, and we are investigating how that failure could have happened. Note, we did not ask the question “Why?” because it can be misleading to an opinion, and we are trying to stay as factual as possible.

A disciplined root cause analysis doesn’t start with ‘why’ – it starts with evidence. Each degradation mechanism tells its own story, and Electrostatic Spark Discharge is just one of them.

For this investigation, we will investigate the hypothesis of a critical bearing failing due to lubricant degradation. Since we are focused on ESD for this article, we will have only one hypothesis regarding the degradation mode being ESD. However, in the real world, if this logic tree were being developed, we would be investigating the six various lubricant degradation mechanisms: oxidation, thermal degradation, microdieseling, ESD, additive depletion, and contamination.
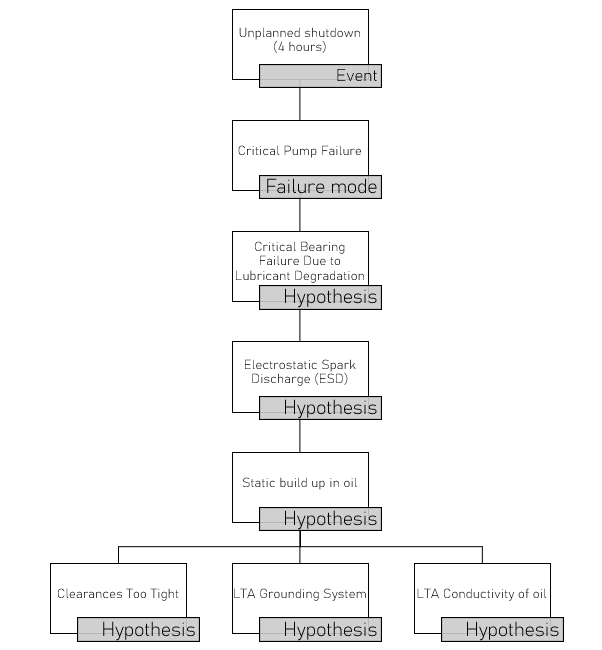
Figure 1: Top part of the Logic tree for ESD

As shown in Figure 1, at the top of the logic tree, we start by placing our hypotheses on the tree, and then using evidence/facts, we can rule them out afterwards. This is a critical step as the investigation should be able to stand on its own in the court of law (even if it may not reach that point). The next hypothesis is the buildup of static in the oil. There are three possible ways for this to occur;

  • Clearances too tight (as discussed earlier, this can lead to molecular friction, which can induce static)
  • Less than adequate grounding system (if a proper grounding system doesn’t exist, then there isn’t an option for the static to dissipate)
  • Less than adequate conductivity of the oil (if the conductivity of the oil is too low, then the charge can build up and cause it to be dissipated along the system, such as the filters)

Now, we need to investigate each of the three main hypotheses stated and find out the root causes for them.

Let’s begin with the Clearances being too tight hypothesis.

For this hypothesis, we will ask the question, “How can clearances be too tight?”. In this case (and we will have to keep it general and in broad buckets, so we can drill down into these later and eliminate as necessary), there are three possible reasons:

  • The OEM could have designed the system such that it was less than adequate (LTA)
  • The flow rate could have been increased above the recommended threshold
  • Incorrect viscosity of the lubricant could cause additional friction (we will dive into this one later).

We will develop the other two hypotheses in Figure 2.
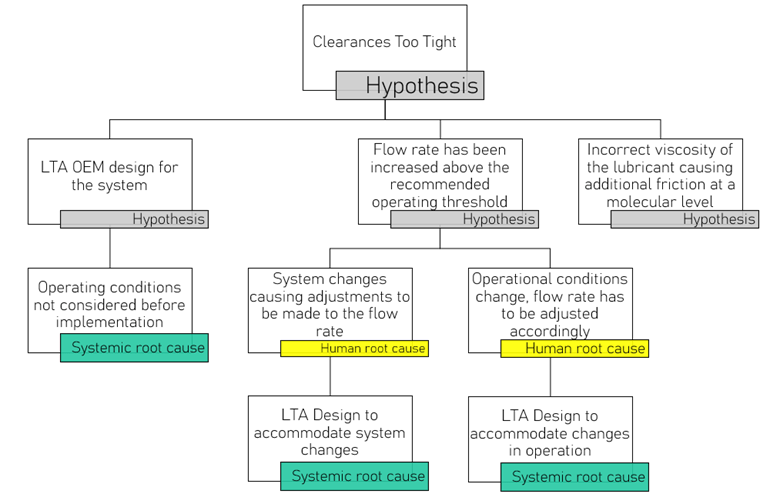
Figure 2: Investigating the hypothesis, "Clearances too tight"

If we further investigate where the OEM did not design the system effectively, we can determine that the operating conditions were probably not adequately considered before implementation. This is a systemic root cause and one that needs to be addressed with the OEM.

On the other hand, if we investigated the flow rate, there could be two main reasons for the adjustment. One could be because of system changes, which forced adjustments to the flow rate. Since a decision was made here, it is a human root cause. Someone decided to change the flow rate based on the variables involved. However, if we investigate why these changes were made (once a human is involved, the question moves from how to why), we can determine that the system was not designed to accommodate these changes. This is a systemic root.

Similarly, if the operational conditions change (such as when a higher output is required, which is different from system changes), then the flow rate must be adjusted. Again, a decision must be made here, and a human is involved. Then we ask the question, “Why?”. In this case, we have the same systemic root, and the design is inadequate to accommodate the necessary changes.

For this part of the tree, we have found some human root causes where decisions were made, as well as systemic root causes. Both need to be addressed when we perform the final root cause analysis. For the human root causes, we can think about the procedures that guided them to make those decisions (if they existed) and amend these accordingly.

On to the next hypothesis, which we have yet to investigate (still under the clearances being too tight), the incorrect viscosity of the lubricant, which is shown in Figure 3. There are a couple of ways in which this can happen:

  • OEM recommendations were not followed
  • There was an unavailability of the specified viscosity of the lubricant
  • There was a less-than-adequate procedure for selecting the correct viscosity of lubricant

If we investigate why the OEM recommendations were not followed, we can find two main reasons. Either they were not documented and therefore could not be followed, or the internal best practice was used instead to replace the OEM recommendations. In both cases, these would be systemic root causes, and we should investigate why these were not documented or why they were replaced.
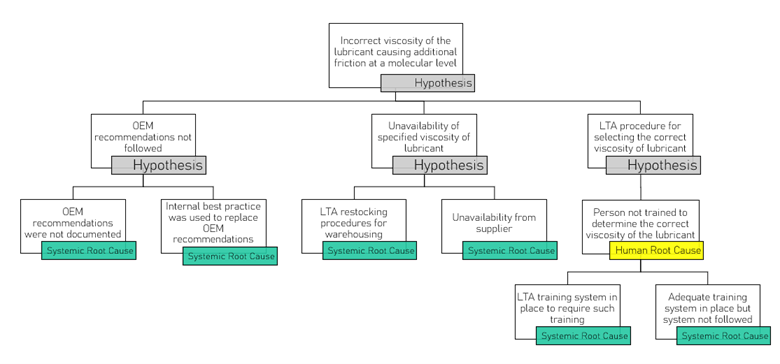
Figure 3: Investigating the hypothesis, “Incorrect viscosity of lubricant”

When investigating the unavailability of the specified viscosity of the lubricant, we can find two main causes. Either there was an issue with the restocking of this lubricant at the warehouse due to their forecasting, or appropriate checks were not carried out. This is a systemic root cause that should be investigated further.

Another hypothesis could be that the specified lubricant was unavailable from the supplier. This is another systemic root cause and should be addressed with the supplier to ensure it is resolved in the future.

When lubricant viscosity errors trace back to missing stock or missing training, the problem isn’t the person or the product – it’s the system that allowed both to fail.

On the other hand, if we examine the procedure for selecting the correct viscosity of the lubricant, we identify a human root cause, as someone would have made the decision on which viscosity to use. But in this case, we need to investigate why the person was not trained to determine this value.

There are two main reasons why a person does not receive training: either it doesn’t exist, or it was not followed. In both cases, these are systemic roots that need to be further investigated and addressed.

Now, we will investigate the next major hypothesis, “LTA grounding of the system” in Figure 4.
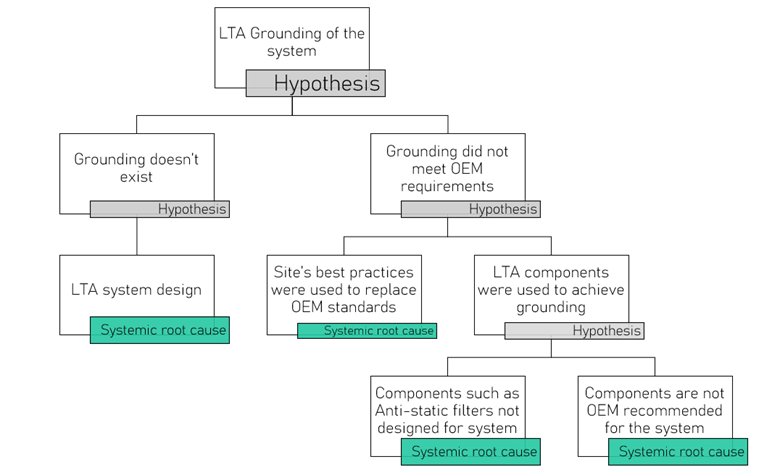
Figure 4: Investigating the hypothesis, “LTA Grounding of the system”

When investigating the grounding of a system, we can identify two major classes: either it doesn’t exist, or it didn’t meet the requirements. If grounding did not exist, then this is an inadequate system design and therefore a systemic root cause. On the other hand, if the grounding did not meet the OEM requirements, we need to determine how this was possible.
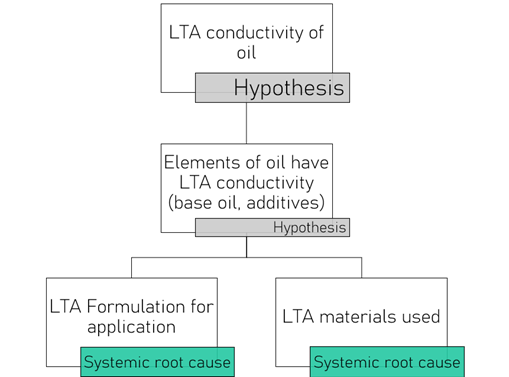
Figure 5: Investigation of the hypothesis, “LTA Conductivity of oil”

There are two possibilities: the site’s best practices were used to replace the OEM standards, which is something we often see, especially if these requirements have worked in the past. This is a systemic root cause that should be investigated. Or there were fewer than adequate components to achieve grounding.

In this case, we can have components that are not designed for the system (do not meet the system’s requirements) or components that were not OEM-recommended and are being used (such as aftermarket products that do not meet the necessary specifications).

Finally, on to the last major hypothesis, “LTA conductivity of the oil,” as shown in Figure 5.

As noted earlier, if an oil has a conductivity of more than 100pS/m, it will be able to dissipate any accumulated charge easily. However, if it falls below this value, the charge will be dissipated in the system at the earliest opportunity.

How can oil have less than adequate conductivity? Perhaps the elements of the oil have a less-than-adequate conductivity. If that is the case, then there can be two plausible reasons for this. Either the formulation was not appropriately designed, or the materials (base oils, additives) were not of a particular standard. Both causes are systemic root causes and should be investigated further to determine if anything can be done to correct these.

If we were to summarize a list of the root causes, we would see that many are systemic, while a few are human, as shown in Figure 6.
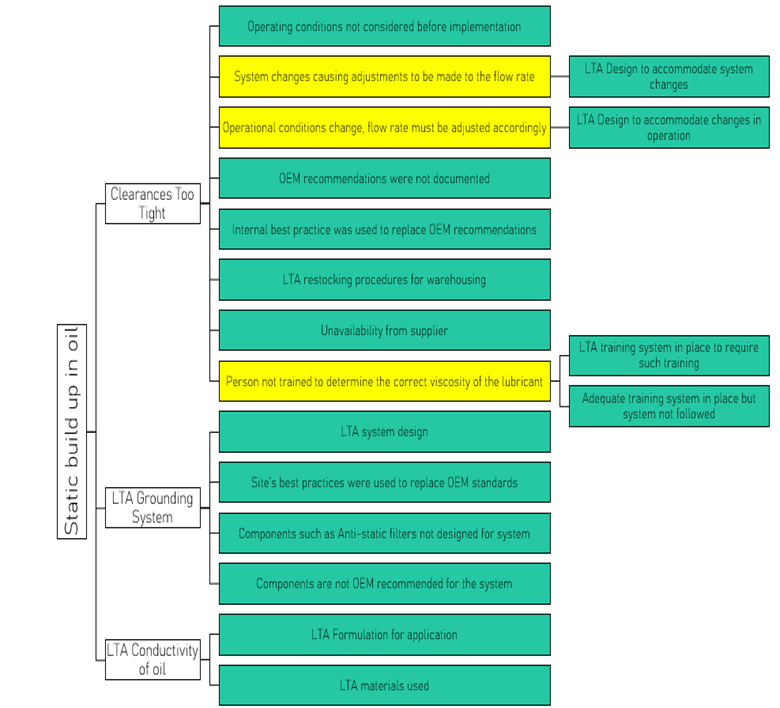
Figure 6: Summary of the root causes of ESD

This further reiterates the need to develop a comprehensive logic tree when investigating any failure, as many root causes are not physical or surface-level. If these are not adequately addressed, the failure mode will recur in the future. The entire logic tree can be found here under additional support material, along with logic trees for other degradation mechanisms.

References

Mathura, S. (2020). Lubrication Degradation Mechanisms: A Complete Guide. Boca Raton: CRC Press.

Mathura, S., & Latino, R. (2021). Lubrication Degradation: Getting into the Root Causes. Boca Raton: CRC Press.

What are Effective Strategies to Prevent ESD in Lubrication?

ESD occurs when there is a buildup of static in the oil; therefore, one of the best methods of preventing it is to ensure that the static levels remain low or are dissipated before they have a chance to wreak havoc on the system. The simplest and most common way of reducing this static is the installation of antistatic filters. These filters can help to remove static from the system before it builds up to dangerous levels, where it can burn the membranes or develop varnish.

Static in oil is inevitable – how you control and discharge it determines whether your system runs clean or burns itself from within.

Ensuring that the system is grounded correctly is another way to guarantee that any built-up static is removed. This is where your electricians can perform checks and install proper grounding devices for your equipment to safeguard against this buildup of static in the system. Therefore, if static charges get built up in the system, they can be dissipated without the effects of ESD.

If oils experience high levels of conductivity, they can conduct static. Typically, if the conductivity is above 100pS/m, there is potential for the fluid to conduct the charge and allow it to be discharged along the system without causing harm.

Unfortunately, there are base oils with low conductivity (below 100pS/m) that cannot carry the charge and dissipate more easily. As such, these types of oils will see an increase in the presence of ESD if not formulated correctly for modern lubrication systems.

As the viscosity of the oil decreases, more force is required to pass through the filters, which can lead to a buildup of static at a molecular level. Additionally, as temperatures decrease, the viscosity also decreases. In these cases, keeping the oil at the system temperature (designed for that particular viscosity) can help to reduce the buildup of static charge in the oil.

Understanding Electrostatic Spark Discharge and Its Impact on Lubrication Systems

Electrostatic Spark Discharge typically occurs when static is built up in an oil at a molecular level, causing it to discharge in the system and create free radicals, which increase the opportunity for varnish to form. This usually occurs at temperatures of around 10,000 °C.

If we were to liken this to an everyday situation, we could think about walking around a carpeted room where the static builds up in our body. When we touch a metallic object (more than likely a door handle), we get a bit of a shock as the built-up static is discharged through us and the door handle.

Inside a lubricant system, static doesn’t just build – it ignites microscopic sparks powerful enough to scar filters and start the chain reaction that leads to varnish.

Similarly, in lubricants, static exists at a molecular level, and in areas of tighter clearances, some molecules are forced to rub against each other, causing a buildup of static. When it accumulates to the point of becoming a full charge, it dissipates at the first opportunity, usually at the filter membrane or some sharp-edged object along the way. These are seen as burnt patches on the filter membrane.

When this spark occurs, it creates a chemical reaction that generates free radicals. Free radicals are highly reactive species that need to engage with other substances. These are the initiators of varnish, and their presence can accelerate reactions, leading to deposits forming in the lubricant. Eventually, this will lead to a system that has experienced both ESD and oxidation.

In this article, we will discuss various identification methods and ways to prevent ESD in modern lubrication systems. We will also spend some time identifying typical root causes for ESD by developing a logic tree as a guide for future investigations.


How to Identify Electrostatic Spark Discharge in Lubrication Systems

Every degradation mechanism produces varying results in the form of deposits or in how these are formed. For ESD, some tell-tale signs alert the user to its occurrence. These include:

  • Crackling sounds / buzzing outside of components – This noise is representative of sparks as they discharge on part of the media/asset. Typically, this occurs when the fluid is in motion, allowing it to be heard near the filters when the system is operating.
  • Burnt or pinhole filter membrane – The filters usually feel the full effect of ESD, and small burn patches or even pinholes are created when ESD occurs. When changing filters, the membranes should be examined for these patches to determine if ESD is occurring.

Free radicals are produced when ESD occurs. As such, this leads to polymerization of the lubricant, which produces varnish and sludge. This is part of the oxidation process, and the antioxidant levels will begin to decrease. During ESD, certain gases are also released in the oil. Some of the lab tests which can be used for identifying where ESD has occurred include:

  • RULER® – Remaining Useful Life Evaluation Routine test, which quantifies the presence of antioxidants in the oil. By trending this over time, one will be able to determine whether the levels of antioxidants are decreasing or not. Typically, this test can be performed twice annually on larger sumps (such as turbines) or the frequency can be increased according to the criticality of the equipment. If the value gets below 25% then this is the critical limit, and methods to regenerate the oil or change it should be explored.
  • MPC – Membrane Patch Colorimetry – this measures the potential of the oil to form varnish or deposits. Depending on the equipment, the warning limits will vary, but a good rule of thumb is to treat results below 10 as normal, those above 15 as within the monitor range, and those above 20-25 as the critical range. Be sure to double-check these levels with the OEM of the equipment.
  • FTIR – Fourier Transform Infrared Spectroscopy can identify various molecules in the oil. It is likened to identifying the fingerprint of the oil, where each molecule has a specific characteristic spectra representative of that molecule. This test can be used to identify the presence of oxidation or any deposits that may have formed.
  • DGA – Dissolved Gas Analysis – this test can be used to identify the presence of particular gases that are released during ESD, such as acetylene, ethylene, and methane.

Those above are just some of the methods that can be used to identify the presence of ESD in a lubrication system.

EasyRCA!

EasyRCA

Recently, most of our concerns stem around getting stuff done faster but wanting the same quality result. For instance, when loading a web page, we expect it to be loaded in one second and use the next five seconds to browse the content and find what we’re looking for. Let’s take a step back and think about loading a webpage ten or fifteen years ago, using a dial up internet connection. I can guarantee you that it took a lot longer than two minutes!

Much of this, “need for speed” has been integrated into our working life where we now have apps that can take vibration measurements in a couple of seconds whereas in the past it took a couple of hours and a few technicians to get the correct reading and then analyse it. The team at Reliability Center Inc, has realized this change in dynamics and are introducing a new tool that steps up to the plate in more ways than one!

The EasyRCA tool was recently launched to allow everyone access to an RCA tool that is (as the name implies) easy to use. The tool is very intuitive and requires minimal training. If a user can click the Enter key on the keyboard or hover above the icons then they can use the tool. The only thing that is required is a stable internet connection and a device with a decent battery life.

One of the first things that stand out with the tool is the use of colour and easy to understand icons! Most tools within the industry shy away from colour but the use of colour to highlight the types of roots (Physical, Human or Systemic) and the stage (Event, Mode, Hypothesis) allows the RCA tree to be easily distinguished and more appealing to the eye.

Figure 1: Snapshot of 5 Why analysis using the EasyRCA Tool

The next interesting feature is that the user can choose the type of analysis that they require! That’s right, the user can choose from the sturdy Causal Tree, to the ever popular 5 Why or the Fishbone (utilizing the 6M method). With each of these types of RCA, the user can add more boxes, move them around the page to group them better or even delete those that they deem irrelevant. The user has full control of the software!

Figure 2: Snapshot of the Fishbone Analysis (6M) using the EasyRCA Tool

If this wasn’t enough to allow easy manoeuvrability, there is even a little “brain” that lights up orange on the screen. This is the virtual assistant and will light up whenever it “thinks” that it can offer assistance through templates from the library. The templates in the library span 50 years of experience that have been built in to allow users a guide for completing RCAs.

Figure 3: Snapshot of the Analysis Assistant using the EasyRCA Tool

What about using the tool to print out a report? Of course the team at Reliability Center Inc thought about this! When performing an RCA, we need to provide a report to all involved! The EasyRCA Tool allows users to produce a report which is downloaded into Microsoft Word. This allows the user to make even more changes if necessary. This report includes all of the pictures / pieces of evidence that were attached during the hypothesis verification process.

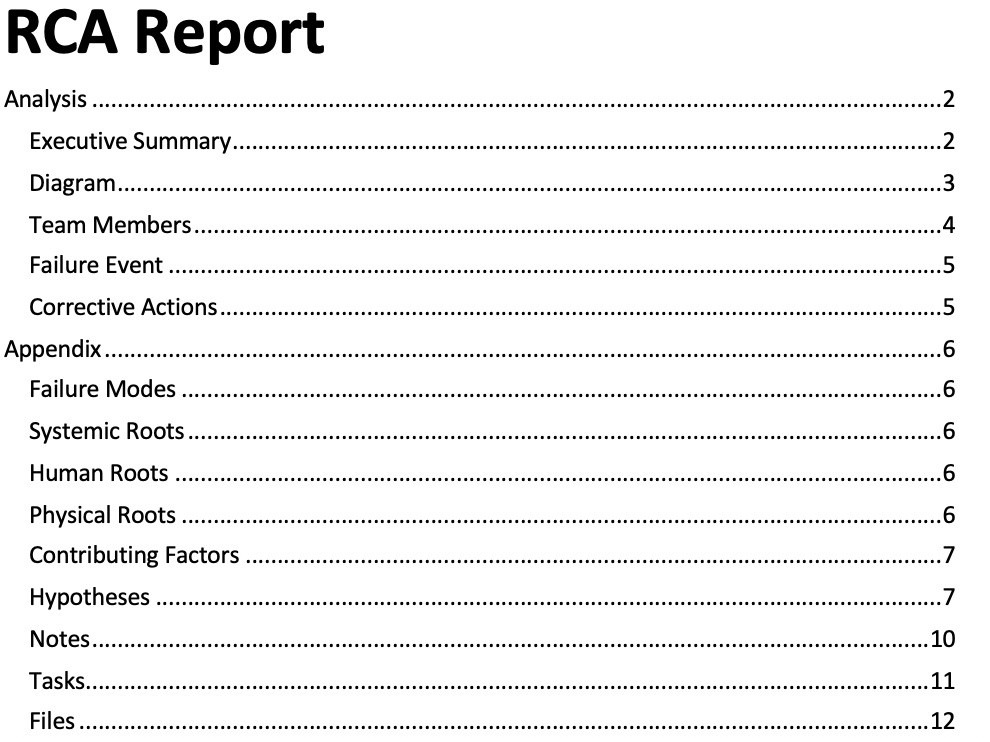
Figure 4: Snapshot of the Table of Contents produced by the EasyRCA Tool

Another very cool feature is that it allows teams to work in real time! For instance, if we have team members scattered across the globe (or around the table), any change that is made by a team member is reflected instantly in all open applications of that particular project in the EasyRCA Tool. When we set up a project, tasks are assigned to team members (who are alerted via email). Thus, each team member can have access to the project, once they have been assigned.

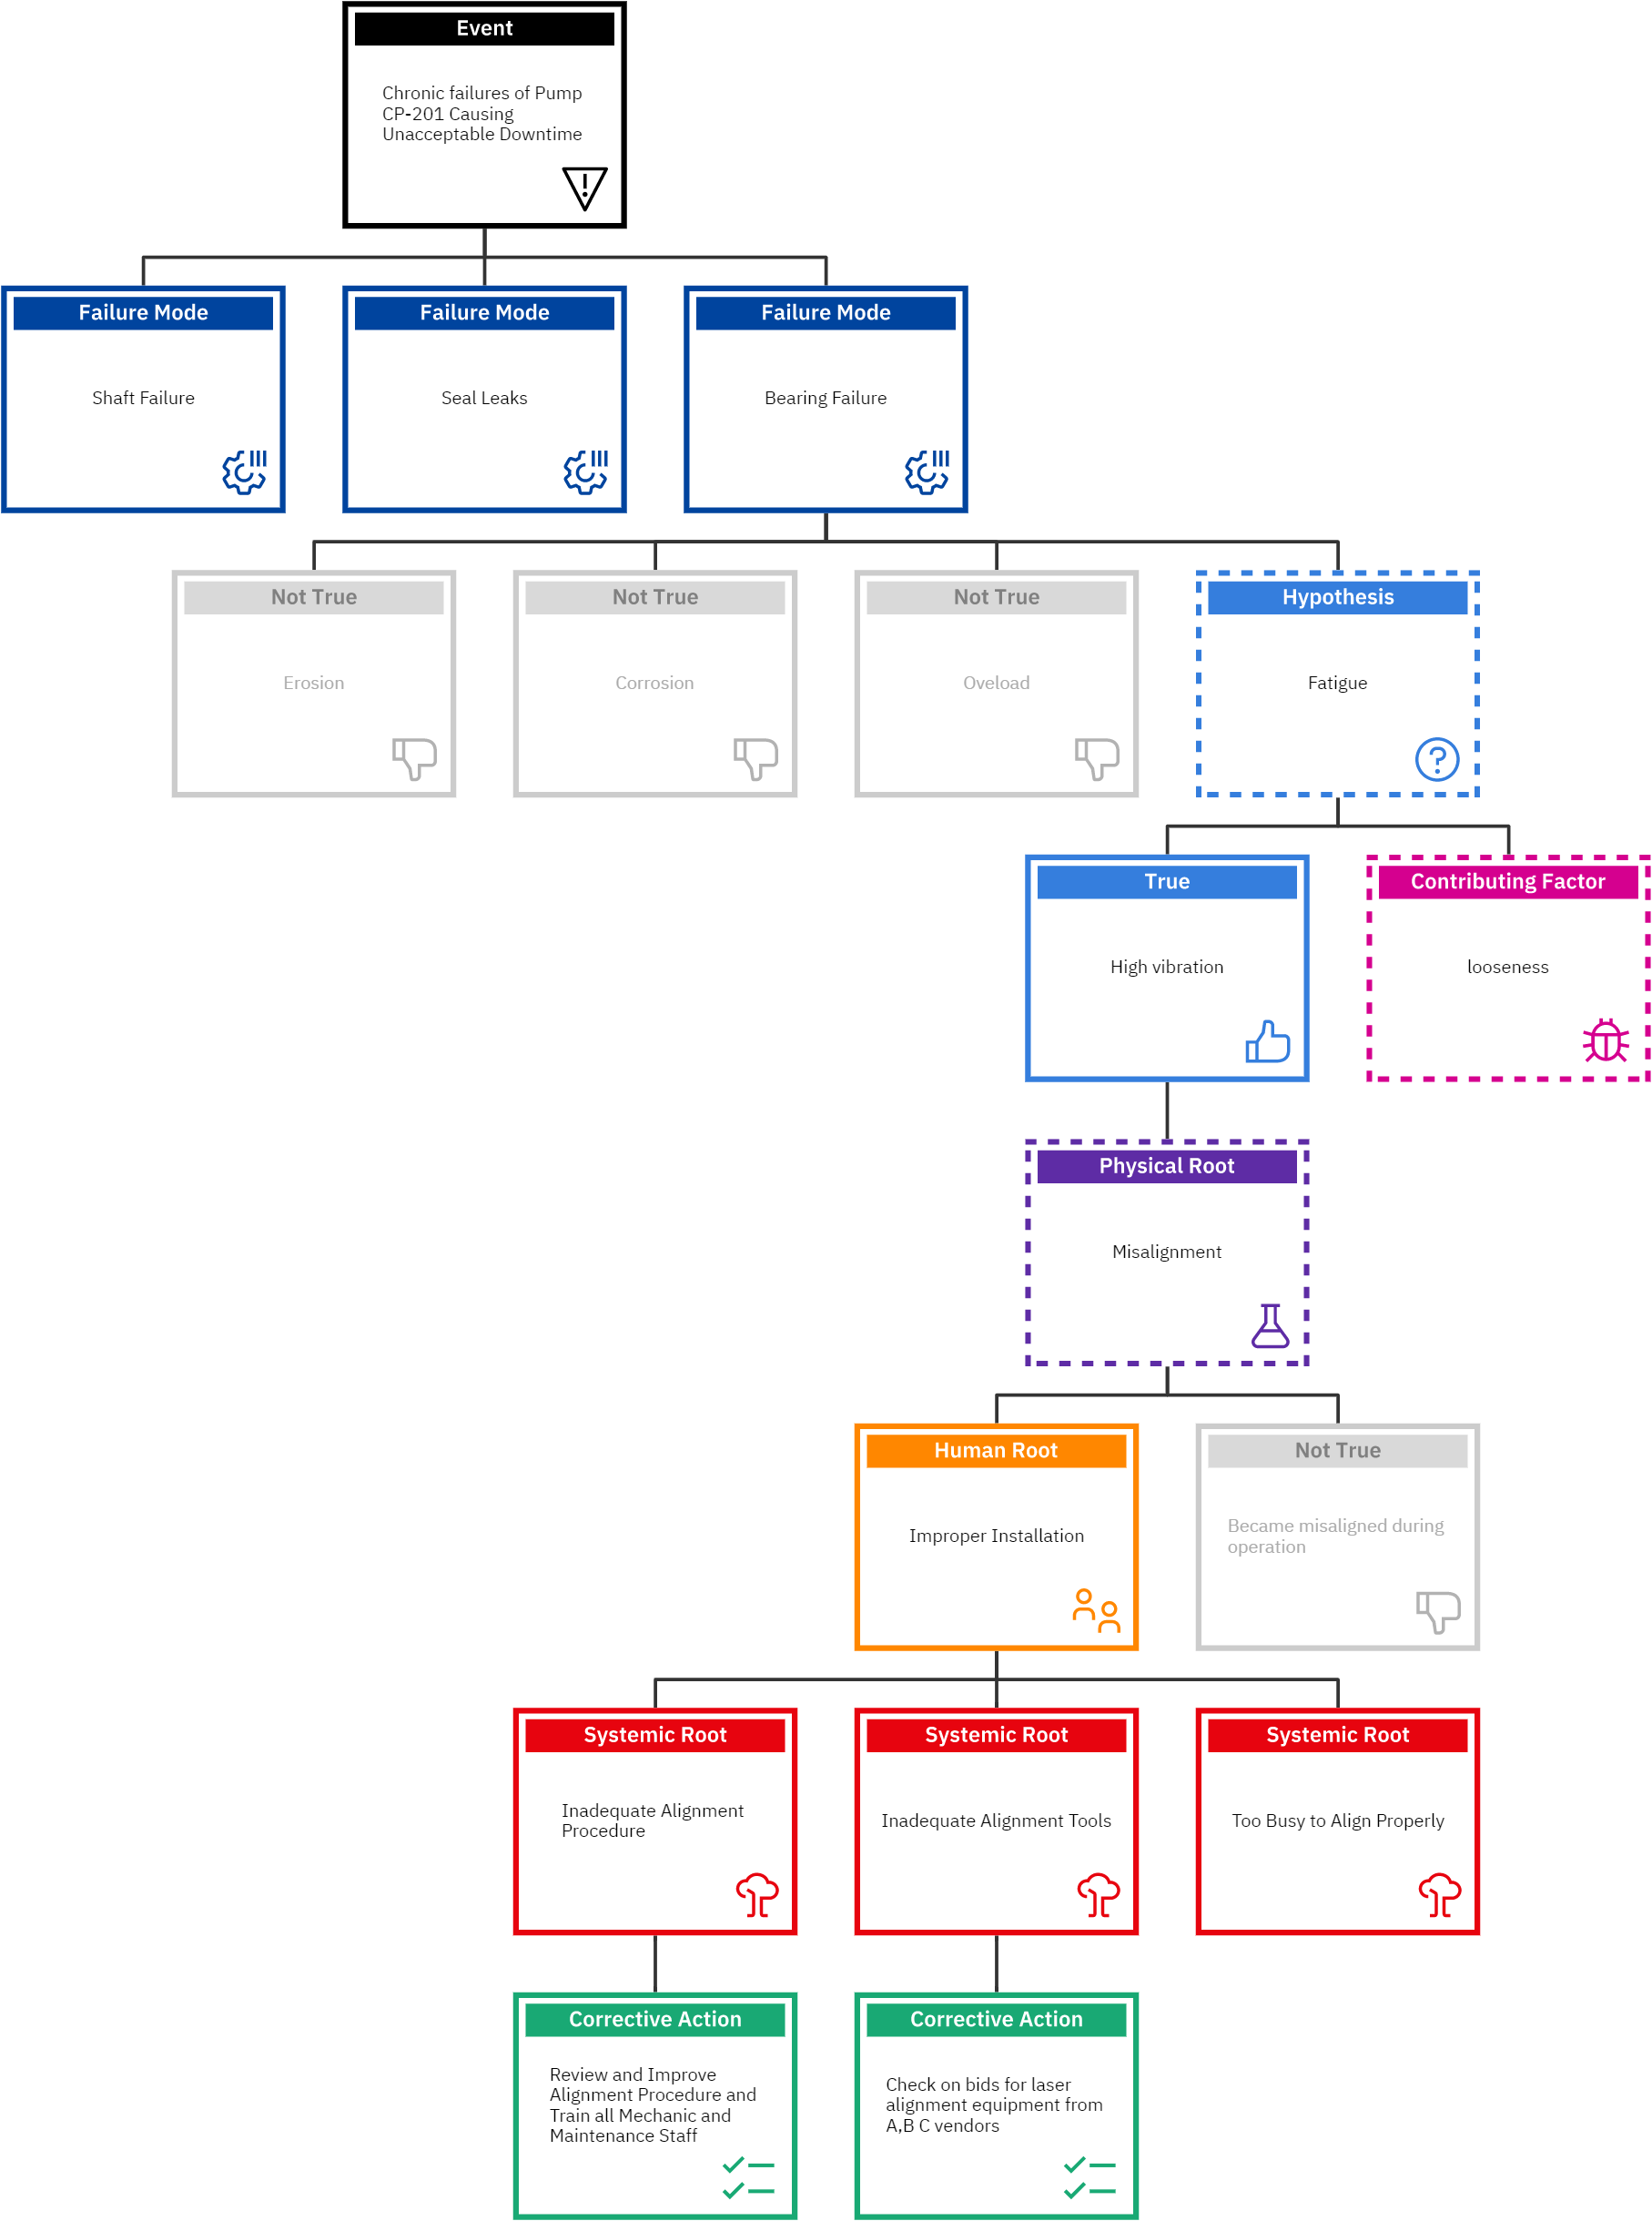
Here’s a quick snapshot of a Causal Tree in the EasyRCA software:

Figure 5: Snapshot of a Pump Failure RCA utilizing a Logic Tree in the EasyRCA software

The EasyRCA Tool is like the baby brother to the PROACT RCA software and allows analysts with little training to adapt this tool and still get results that add value!  And, best of all, you can get started immediately.

Feel free to book a demo of the EasyRCA tool and check out the family of tools as they keep expanding to help better serve the industry!


Written by Sanya Mathura, CEO & Founder of Strategic Reliability Solutions Ltd. 

Lubrication failures in Ammonia plants

Quite often, when lubrication failures occur, the first recommended action is to change the lubricant. However, when the lubricant is changed, the real root cause of the lubricant failure has not been solved. As such, the cause of lubrication failure will continue to be present and may escalate further to develop other problems.

Essentially, this can cause catastrophic future failures simply because the root cause was not identified, addressed and eradicated. Moreover, the seemingly “quick fix” of changing the lubricant, is usually seen as the most “cost effective” option. On the contrary, this usually becomes the most expensive option as the lubricant is changed out whenever the issue arises which results in a larger stock of lubricant, loss in man hours and eventually, a larger failure which can cost the company at least a month or two of lost production.

In this article, we investigate lubricant failures in Ammonia plants and their possible causes. Some Ammonia plants have a developed a reputation for having their product come into contact with the lubricant and then having lubrication failures occur. As such, most Ammonia plant personnel accept that the process materials can come into contact with the lubricant and usually change out their lubricants when such issues occur. However, there are instances, where the ammonia is not the issue and plant personnel needed to perform a proper root cause analysis to determine the root cause and eradicate it. Here are a couple of examples of such instances.

Livingstone (1) defies the Lubrication Engineers Handbook in their description of ammonia as an inert and hydrocarbon gas that has no chemical effect on the oil, stating that this is incorrect. Instead, Livingstone (1) lists the number of ways that Ammonia can react with a lubricant under particular reactions such as;

  • ammonia being a base that can act as a nucleophile which can interact with any acidic components of the oil (such as rust/corrosion inhibitors)
  • reaction of ammonia with carboxylic acids (oil degradation products) to produce amides which cause reliability issues
  • transesterification of any ester containing compound to create alcohol and acids and the reaction of ammonia with oxygen to form NOx which is a free radical initiator that accelerates fluid degradation.

As such, one can firmly establish that ammonia influences the lubricant and can lead to lubrication failures should that be the cause of the lubricant failure.

The Use of Root Cause Analysis    

Van Rensselar (2) quotes Zhou as saying the best method for the resolving varnish is to perform a root cause analysis. Wooton and Livingstone (3) also advocate for the use of root cause analysis to solve the issue of varnish. They go on to explain that the characterization of the deposit aids in determining the root cause of the lubricant degradation. As such, Wooton and Livingstone (3) have developed a chart to assist in deposit characterization as shown below.

Deposit Characterization graphic from Wooton and Livingstone (3)

Wooton and Livingstone (3) discussed that with the above figure, once the deposit can be characterized then the type of lubricant degradation can be more accurately identified. As such, the root cause for the lubricant degradation can now be firmly established thereby allowing solutions to be engineering to control and reduce / eliminate lubricant degradation in the future.

Case Studies

A case study from Wooton and Livingstone (3) was done with an Ammonia Compressor in Romania which experienced severe lubricant degradation. In this case study, they found that when the in-service lubricant was subjected to two standard tests namely MPC and RULER, both tests produced results within acceptable ranges. As such, there was no indication from these tests that the lubricant had undergone such drastic degradation as evidenced by substantial deposits within the compressor. Thus, it was determined that the deposits should be analysed as part of the root cause analysis.

For the deposits from the Ammonia compressor, Wooton and Livingstone (3) performed FTIR spectroscopy to discover that its composition consisted of mainly primary amides, carboxylic acids and ammonium salts. It was concluded that the carboxylic acids formed from the oxidation of fluid while in the presence of water.

In turn, the carboxylic acids reacted with the ammonia to produce the primary amides. These amides consisted of ammonium salts and phosphate. As such, the onset of carboxylic acids within the system eventually leads to the lubricant degradation. Thus, an FTIR analysis for carboxylic acids was now introduced to this Ammonia plant as well as MPC testing to monitor the in-service lubricant.

Additionally, chemical filtration technology was implemented to remove carboxylic acids within the lubricant. These two measures allowed for the plant to be adequately prepared for lubricant degradation and avoid failures of this type in the future.

Another case study was done in Qatar with an ammonia refrigeration compressor which was experiencing heavy deposits due to lubrication degradation. For this Ammonia plant, high bearing temperatures and deposits were found on the bearing.

Upon investigation, it was realized that the lubricant had been contaminated externally and there was restricted oil flow to the bearings. After a FTIR was performed it was deduced that that the deposits were organic in nature and there were several foreign elements including high levels of carbon and primary amides.

From further root cause analysis, it was determined that the high temperatures observed were due to the lubricant starvation. Due to these high temperatures, oxidation initiated and with the high levels of contamination (mainly from ammonia within the process) this lead to degradation of the lubricant in the form of heavy deposits.

The bearing oil flow was increased and reduction in external contaminants were implemented. Oil analysis tests of Viscosity, Acid Number, Membrane Patch Calorimetry and Rotating Pressure Vessel Oxidation tests were also regularized in the preventive maintenance program. Thus, for this failure, some operational changes had to be made in addition to increased frequencies of testing. With these measures in place, there would be a reduced likelihood of future failures.

From the case studies mentioned, it can be concluded that ammonia systems have a higher possibility of undergoing lubricant degradation due to the contamination of the lubricant by ammonia gas / liquid due to its properties. However, it must also be noted that the ingression of ammonia into the lubrication system is not the only cause for lubrication failure.

Therefore, it is imperative that a proper root cause analysis be carried out to determine the varying causes for lubrication failure before the ingression of ammonia accepts full responsibility for any such failure.

References:

  1. Livingstone, Greg (Chief Innovation Officer, Fluitech International, United States America). 2016. E-mail message to author, March, 08.
  2. Van Rensselar, Jeanna. 2016. “The unvarnished truth about varnish”. Tribology & Lubrication Technology, November 11.
  3. Wooton, Dave and Greg Livingstone. 2013. “Lubricant Deposit Characterization.” Paper presented at OilDoc Conference and Exhibition Lubricants Maintenance Tribology, OilDoc Academy, Brannenburg, Rosenheim, Germany, United Kingdom, January 22-24, 2013.

Written by Sanya Mathura, CEO & Founder of Strategic Reliability Solutions Ltd. 

PROACT Review

Root Cause Analysis has always been dear to my heart. The procedure involved in finding the root causes and addressing them have intrigued me greatly as it involves using all your data gathering and cognitive skills. In the past, it was a bit difficult to properly perform RCAs since it usually meant jumping around different types of software. For instance, depending on the type of analysis that I wanted carry out, I would either use a Fish Bone Diagram or Cause and Effect Logic Tree. Depending on the type that I needed to use, I would have to switch programs just to get these generated. Then, there’s the issue of writing the final report and utilizing my expert copy and paste skills with Microsoft word while toggling excel worksheets to determine the costs attached to the failure.

Needless to say, I was very impressed when introduced to the PROACT software. It has an extremely friendly user interface (in some cases, I can even use drag and drop options!) which is very easy to navigate even for a beginner like me at the time. What I really love about the software is that it bridges the gaps and guides users (both for beginners and experts) on the RCA process. By allowing users to follow a step a by step process it ensures that users don’t forget vital pieces of information that are absolutely critical to the RCA.

If you are familiar with RCA, you will be aware that the basis of any RCA is properly establishing the Severity of the failures. As such, the first step when the user enters the software, is the assigning of the Severity of the failure with the Severity Calculator. This calculator can even be customized for varying applications! Afterwards, the profile of the failure is then defined. This profile allows the user to identify elements that may have been forgotten if the RCA was being done from scratch. The Severity Calculator also allows users to determine the type of analysis that is fit for the severity index. Depending on the severity, the user can be guided to use either; 5 Whys, Fish Bone Diagrams or Cause and Effect Logic Trees. This is definitely one key advantage since it allows for different forms of analysis based on the severity.

Next the Critical Success Factors are inserted. The strategic placement for the input of these factors at this point in the analysis is purely genius! It forces the user to determine which factors directly impact them and these are usually placed on the final report. These CSFs start shaping the pending RCA into the mould that we need. Once these CSFs are established, then the objectives need to be defined. These help the analyst in guiding their RCA and ensuring that it is kept focused. It is easy to become distracted when performing these types of analyses since users are presented with an abundance of information. The definition of these aspects help the analyst to keep on track.

As with any RCA, there must be a team involved. The PROACT software allows users to delegate different tasks to different team members! It can even track the status of these events. Instead of sending long reminder emails (which tend to choke one’s inbox and can be easily missed), it is essentially easier to view the status of the assigned tasks using the PROACT software. This is a definite advantage of the software!

Now to the core of the software, the development of the RCA! Users are allowed to define the event that lead to the failure. Here’s where the software gets very interesting!!! Users can pull from existing templates dependent on the type of failure! This is the highlight of the PROACT software for a user like myself! It is very interesting to view templates (there are over 300 templates) of common failures and compare these to what the user has actually experienced. It allows the user to be able to access years of experience of a consultant at their fingertips! The team at Reliability Center Inc have definitely put a lot of work into developing these templates and have drawn upon their actual field experience for the past30+ years! This is the absolute game changer for the software!

During the building (or growing) of the Cause and Effect Tree, the user is allowed to authenticate their hypotheses and can attach pictures from the failure as verification for ruling out or accepting that mode as one of the root causes. These pictures can then be input into the final report without the need for cropping, cutting and pasting and all the exciting formatting issues that tend to occur when trying to include pictures in the final report.

PROACT also allows for users to input financial data. Another game changer for me! Users can define the costs associated with the downtime for particular failures, repair costs or even manpower costs. These all help to put a financial value on the cost of the failure being investigated. This neat trick is crucial for the review by upper management! Additionally, the final steps in any of the RCAs is to determine recommendations for the latent causes that were determined. These will be the courses of action to be taken to prevent failures of this nature from occurring in the future.

Overall, the PROACT software is indeed a time saver, keeps excellent track of the findings and collections of the investigation at hand and produces a very succinct, detailed report that anyone from upper management to the engineers can clearly understand. I love working with this software and my clients are always very impressed that this type of software actually exists and is so easy to use! I would highly recommend any user (novice or expert) in the reliability field to use the software in their everyday tasks and realize the impact that it has on increasing the efficiency of RCAs and their ROIs to their organizations.

More information can be found at www.reliability.com

Written by Sanya Mathura, CEO & Founder of Strategic Reliability Solutions Ltd.