The Smart Bubble System, developed by Evamo, allows users to gain deeper insight into the behavior of air in their oil. It turns a general volume-based quantification into actionable metrics to improve your system’s reliability and performance. The SBS captures the following metrics:
- Bubble diameter
- Air content in your system
- Bubble count
- Bubble size-distribution
- Oil-Air contact surface
- Transient bubble events
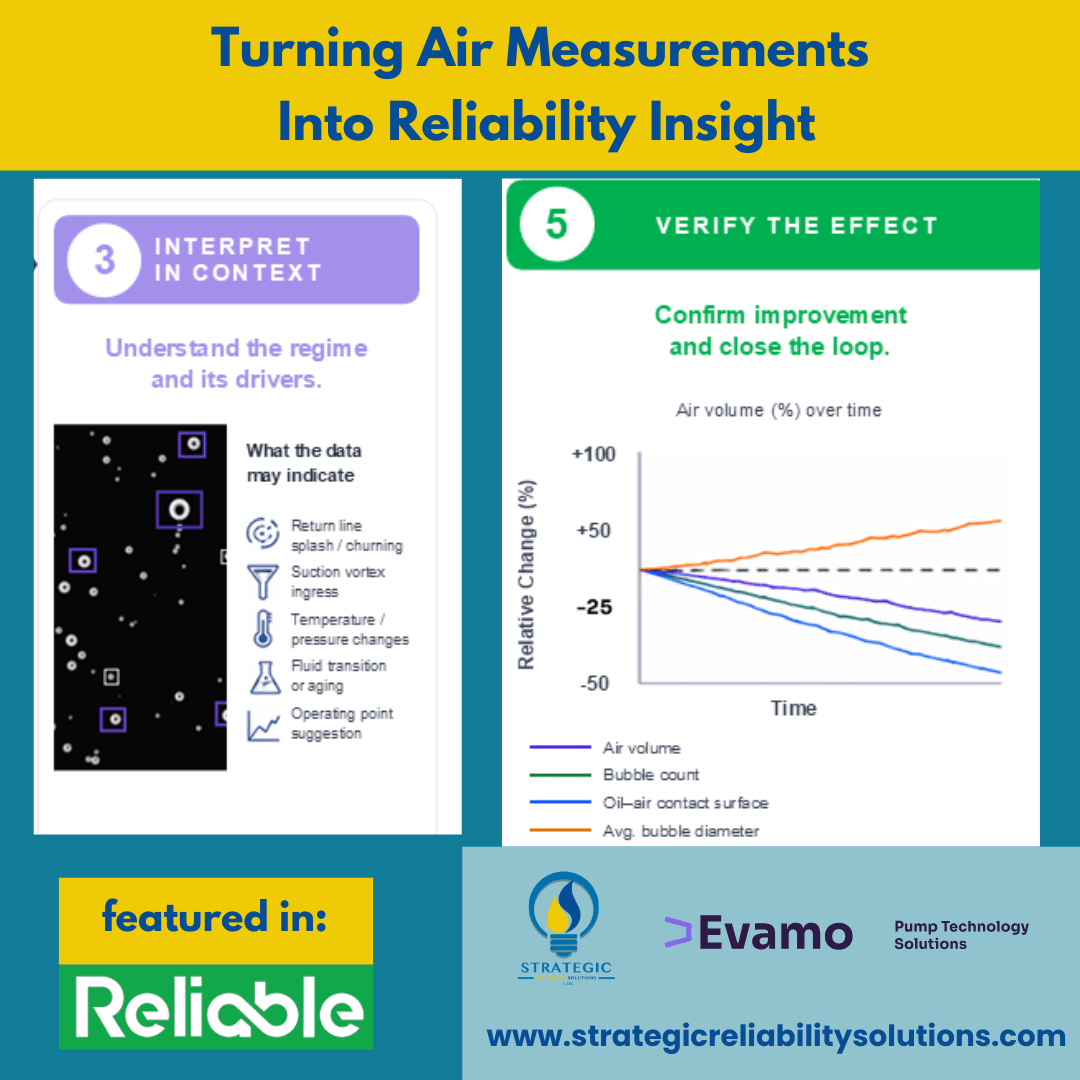
These metrics are directly related to what users see in the field. As such, it closes a gap that many users often experience when relating lab results to field integrations. Users can also trend whether the number of smaller bubbles increased, whether large bubbles began to form in their system, or whether there were transient spikes due to particular conditions in temperature, load, speed, or even return-flow conditions.
Here are a couple of examples that highlight how these values can be interpreted in the field:
- If a rise in fine-dispersed bubbles occurs, then this can be indicative of persistent gas transport through the system. This affects the oil’s compressibility and can even lead to a stability issue.
- If there is a rise in the number of larger bubbles, this can indicate that there is localized entrainment, return-line impact, free-surface interaction, and stronger ingestion events. If these are not addressed in time, they can damage your components.
- If one detects an increase in oil-air contact surface, this can indicate that gas distribution has become more degradation-relevant in the system. This may be despite no dramatic change in the total air content.
- If transient bubble events are present, this can directly point to issues related to specific operating states rather than a general system condition that needs to be addressed.
- If smaller bubbles occur, this leads to much worse thermal conductivity. As such, higher operating temperatures would need to be cooled down directly with a high amount of energy, or this can lead to a much higher thermal oxidation rate. In each case, the system efficiency is reduced.
These observations set the stage for more in-depth analysis and contextual interpretation to determine whether the pattern is fluid-driven, hardware-driven, or operating-point-driven. A workflow can be easily implemented to reduce risks to your operation, as highlighted in Figure 3 below.
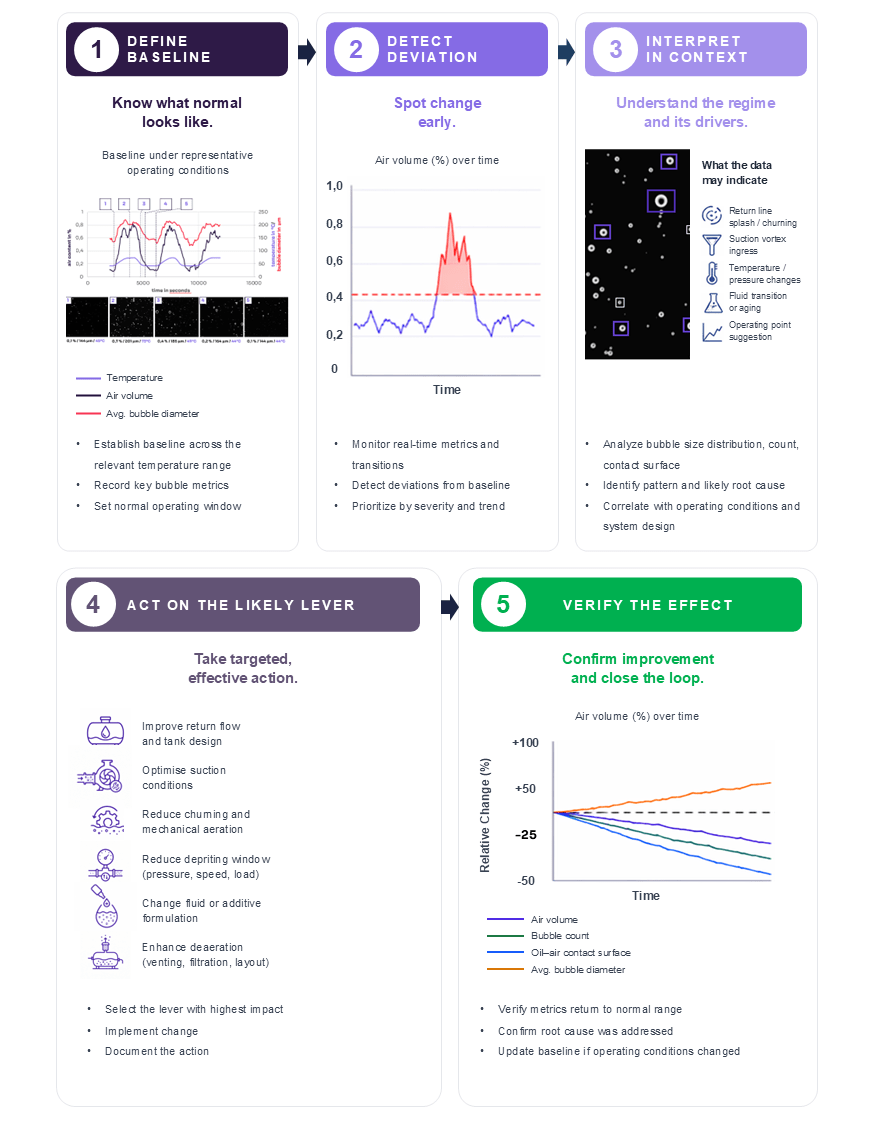
A robust methodology for the characterization and optimization of your system should follow a structured measurement and interpretation workflow:
- Definition of the System Baseline
The first step is to establish a representative baseline condition by continuously measuring the system’s actual operating state. These parameters should include temperature, rotational speed, torque, flow velocity, pressure conditions, and load states. The baseline must capture the dependency of the oil–air behavior on these operating variables to provide a reliable reference for subsequent evaluations and further steps. - Detection of Deviations and Dynamic Transitions
Deviations from the baseline are identified using real-time monitoring metrics and transient analysis. Changes in aeration behavior, bubble content, or flow characteristics are quantified relative to the reference baseline state established in Step 1. In parallel, a prioritization strategy should be defined to identify the most critical deviations and focus optimization efforts on the parameters with the highest system impact. - Contextual Interpretation of Deviations
Detected deviations must be interpreted within the system’s physical context. The origin of the observed behavior should be determined by correlating the measured size distribution and temporal system response with potential mechanisms such as splashing, churning, vortex formation, temperature variations, fluid aging, or changes in the operating point. This contextual analysis enables the differentiation between transient operational effects and systematic design-related issues. - Implementation of Targeted Corrective Measures
Based on the contextual interpretation, focused and goal-oriented design modifications can be implemented. Possible optimization measures include adjustments to return-flow geometries, improvements in suction conditions, reductions in churning effects, optimization of pressure levels, speed or load adaptations, fluid conditioning, changes to additive formulations, or enhanced filtration strategies. The corrective actions should directly address the identified root causes of the aeration behavior. - Validation Through Continuous Measurement and Improvement
The effectiveness of the implemented measures must be validated through continuous monitoring and iterative evaluation. Repeated measurements under comparable operating conditions ensure that improvements are sustainable and quantifiable. This closed-loop approach enables continuous system refinement and supports long-term optimization of the behavior of oil–air mixtures.
By moving beyond the standard quantitative measure of air in oil, we can address critical issues occurring in our equipment. By measuring and interpreting metrics correctly, you can optimize your system’s overall performance, make it goal-oriented, and keep it focused. This supersedes the often-used trial-and-error approach, which can ultimately damage your equipment.
For those interested in taking a more serious approach to understanding the health of their oil and preventing issues before they occur, the SBS can help improve the reliability of their system.
What you see is what you get!
Find out more in the full article, "Air in Oil: The Reliability Variable Many Programs still treat too late" featured in Reliable by Sanya Mathura, CEO & Founder of Strategic Reliability Solutions Ltd, David Placzek, Dr. Lukas Hafner