Tagged: trinidad

Hidden Failures in Lubrication programs: Designing a Resilient Lubrication Strategy Part 3

Before you begin to design a resilient lubrication strategy, you need to know where your current lubrication strategy falls as per industry standards. You can review part 1 in this series where we break down the various levels of maturity for lubrication programs. Afterwards, determine your hidden failure modes which you can read about in part 2 of our series.

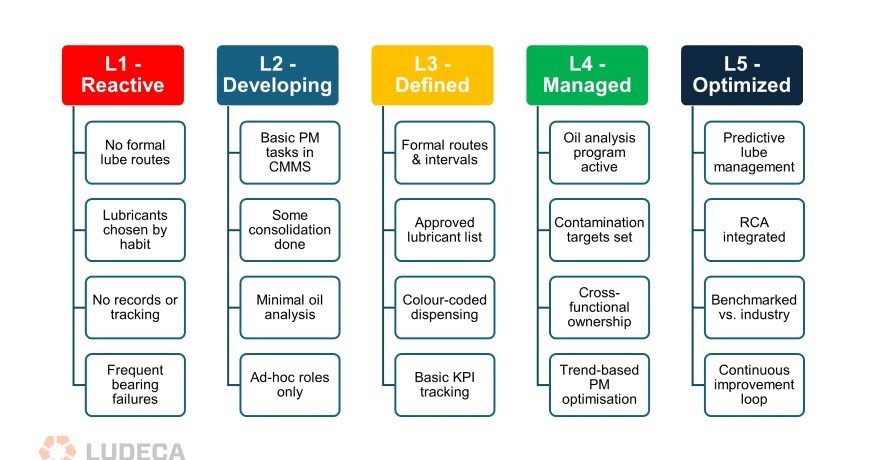
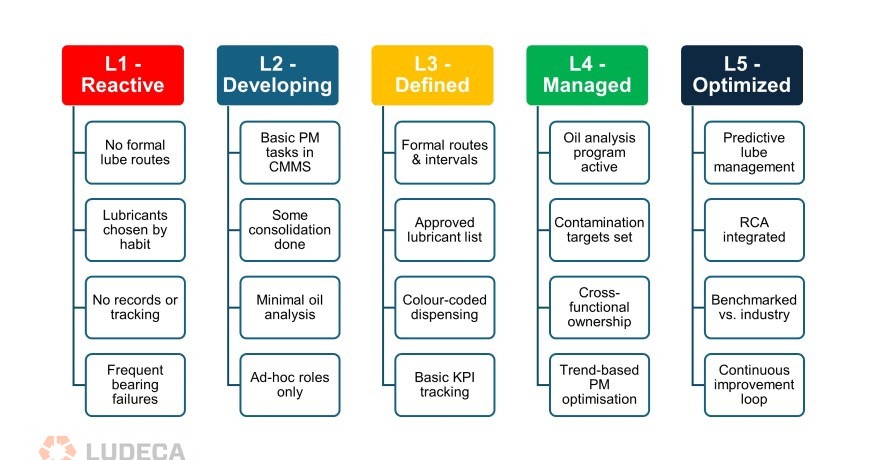
As a quick refresher, here are the various maturity levels for lubrication programs.
Varying-levels-of-Maturity-for-Lubrication-Programs_870x460 (1)
Figure 1: Varying levels of Maturity for Lubrication Programs

Once the current lubrication program level is identified, we then need to audit the systems that we have in place to understand what gaps need to be filled. While wanting to achieve level 5 is always the goal, we also must be cognizant of our constraints. Within our industry, some constraints which typically exist include; budget, manpower, resources and time. Each of these have crucial roles to play in determining the success of our lubrication program.

Closing the gaps

Once your gaps have been identified, this is not the end of the story. We need to put procedures and strategies in place to make sure that we can close these gaps. This is where we get to re-evaluate work orders, ensure that they are now being aligned with our condition monitoring programs and design our systems to have proper lube routes as well as frequencies or relubrication with the correct lubricant.

After auditing our condition monitoring program (which forms part of the lubrication program), we should also assign dedicated personnel for interpretation of oil analysis results as well as sampling. Being able to access consistent data and trending will help us to understand our equipment better and possibly detect failures before they occur.

Part of auditing of condition monitoring program includes setting up alarm limits within our system which are aligned to our equipment and environment. While the lab will have the standard set of alarms, we should take a closer look at what really resonates with our equipment. For instance, if we start seeing a spike in copper right after a turnaround where certain parts were changed, then this may be normal and just break in wear. However, the lab may flag it as a component failing (if we did not provide them with adequate details).

Contamination

One of the biggest sources of failures for our equipment is contamination. By designing our lubrication program to eliminate sources of contamination (within or control), we can essentially minimize equipment failure. Most contamination can happen during oil transfer to equipment where the oil may either be placed in dirty containers, or have contaminants enter their packaging from improper storage conditions.

By designing our lubrication program to address contamination and have measured results as goals for our program, we can improve our systems. Without clear cleanliness targets we cannot evaluate the impact of reducing contamination. Desiccant breathers and proper sealing techniques can also help in reducing the ingress of contaminants into the system.

Training and Accountability

Designing a lubrication program must also include the training of the employees to execute the program. They are the ones responsible for its success and if not trained or briefed about the importance of their assigned roles, then they will not bring the value to the program and unfortunately, it will fail.

By allocating responsibilities to employees and having them accountable for these roles it brings some form of ownership into the program. This allows the program to thrive more as they are genuinely invested in making it a success. Once they have been trained, they can in turn continue to spread the word about lubrication and best practices to their peers.
oil-analysis-test-to-identify-health-of-lubricant_870x460
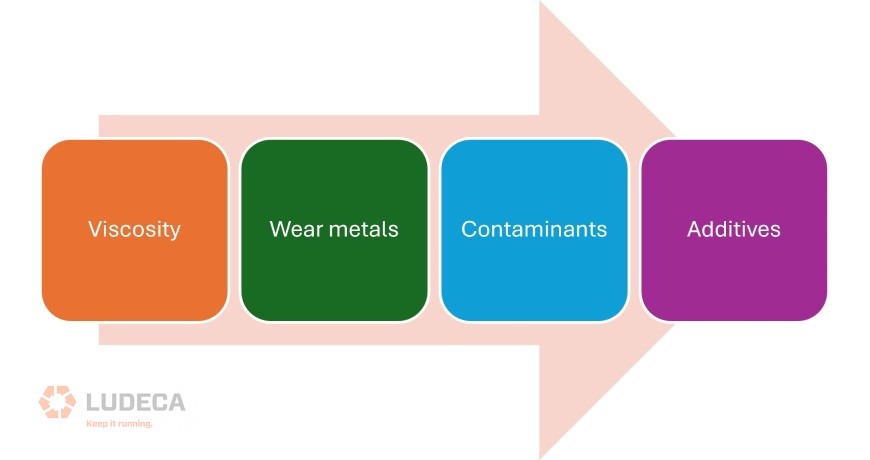
Figure 2: Oil Analysis Tests which can be performed to identify health of lubricant

Essentially, we can have hidden failures in our lubrication programs, but we can uncover these and redesign our program to become a success through auditing and putting proper strategies in place. Next time you think about your lubrication program, explore its robustness and think about ways in which you can improve it to ensure that it is adding to the value that it should.

Hidden Failures in Lubrication programs:  Failure Modes Which Are Not Being Monitored Part 2

In part 1 of this series, we took a closer look at the Illusion of a Good Lubrication Program. One of the key findings was that through audits, failure modes were not being monitored actively or in some cases not at all. In this part of the series, we will do a deeper dive into the failure modes that can be missed with lubrication programs.

Critical but not obvious failure modes

With our standard oil analysis programs, there are a few key tests that can indicate the health of an asset. These include; viscosity, presence of wear metals, contaminants, additives, moisture levels and cleanliness levels (ISO 4406). From these tests, we can easily identify if we may have some cause for investigation or concern.

oil-analysis-test-to-identify-health-of-lubricant_870x460
Figure 1: Oil Analysis Tests which can be performed to identify health of lubricant

If there are changes in viscosity this can be an indication of a few different things. A decrease in viscosity can indicate that there is possible contamination with fuel or even thermal cracking of the lubricant. However, if the viscosity increases, this can indicate contamination with water (or another higher viscosity grade lubricant, accidentally) or the presence of oxidation degrading the lubricant.

The presence of wear metals can indicate that there is wear occurring within your components. However, there are varying limits depending on the type of oil and the application in which it is being used. For instance, the alarm limit for iron in diesel engines is usually around 60ppm while the alarm limit for iron in gearboxes is closer to 300ppm (this will vary by OEM). As such, it is important to set appropriate alarm limits for various components and oils depending on their applications and environments.

If there is the presence of contaminants, this can easily flag that something is getting into the system (either via an external or internal source) which shouldn’t be there. Contaminants can also act as catalysts to speed up degradation of lubricants. Again, they have varying limits depending on application and type of oil, but they should be monitored.

By understanding the concentration of additives and observing their trends, we can also determine if wear is occurring (by the decline in antiwear additives) or if oxidation is happening (by the decline in antioxidants). By quantifying the concentration of additives, we can also determine if there was possible contamination with another lubricant (if an element shows up which should not be there!). Through the monitoring of additives, we can quickly determine the internal conditions that the lubricant is exposed to, whether or not wear is occurring and if contamination is present.

Assessing the Gap

These tests can give an indication of what’s happening inside your oil before the failures occur. Through proper trending and by establishing alarm limits which can warn users in time, failures can be avoided. This is the value of developing a robust lubrication program where impending failures can be detected, avoided and uncovered before they cause any harm to our system.

Stay tuned for part 3 where we dive into designing a resilient lubrication strategy.

Hidden Failures in Lubrication programs: The Illusion of a Good Lubrication Program Part 1

Typically, when lubrication programs are developed and implemented, everyone automatically believes that all lubrication issues have been solved and will never occur again. This is furthest from the truth! In this 3-part series, we will explore some of the hidden failures in lubrication programs. We will start off with dispelling the illusion of a good program then dive deeper into the failure modes which are not being monitored and finally, ways to design a resilient lubrication strategy.

How “good’ is good?

Many manufacturing plants have some form of a lubrication program in place. But many are not familiar with how to gauge this against best practices or industry standards. The following figure gives a brief description of the various stages of a lubrication program that can exist.

Varying-levels-of-Maturity-for-Lubrication-Programs_870x460 (1)
Figure 1: Varying levels of Maturity for Lubrication Programs

Although many plants may fall within the L2-L4 stages (and some in the L1 stage), there is still a lot of data missing on the documentation on lubrication failures and how these are being addressed (if they are being addressed at all). As such, there are no direct actionable items that link failures to strategies for preventing these in the future.

Industry standards attribute that around 33% of bearing failures are due to lubrication challenges. However, if our lubrication program is not capturing these lubrication related failures then the real root causes are not being addressed directly for these issues. As such, they are not being solved and we are adding to the overall unreliability of the plant. In these instances, our lubrication program is not adding value from a reliability perspective and is actually hiding some failures.

The real failures

Lubrication can account for a significant number of failures, but contamination also plays a crucial role. As per a study carried out by NRCC & STLE (National Research Council Canada & Society of Tribologists and Lubrication Engineers), particle induced failures are responsible for approximately 82% of failures. This means that our equipment is majorly failing because of contamination.

In our “Defined” maturity level 3 program, contamination is not even addressed. Hence, we could be missing the opportunity to remove this from our system and by extension reduce failures associated with contamination. With our level 3 program, we also do not have alarm limits for our oil tests to help us understand if we are approaching dangerous levels or not. This will cause us to miss opportunities where we could have prevented components from failure.

Even with a moderately tiered lubrication program, we are missing a lot of opportunities for improvement of the overall reliability of our plant. This can lead to the lubrication program being viewed as unsuccessful when in fact, it just didn’t capture the right data.

Apart from capturing data, we also need to act on that data. Even if we have an oil analysis program in place, if we are not trending the data or coordinating with our maintenance teams to troubleshoot potential issues, then the lubrication program is not helping to raise the reliability of the plant. The program is in fact hiding some of these inefficiencies.

When was your last audit?

Even though we may have built a lubrication program, have we audited it? Creating a lubrication program may be an easy feat for many but implementing it is another story in itself. This is where some programs fail because they exist on paper but not in practice. If our technicians are not collecting the right data or observing proper storage and handling techniques, then the lubrication program is just another piece of paper in the drawer collecting dust.

For those who have managed to get the lubrication program off the ground and have the right people integrated into it, an audit on the program is still a good idea. Sometimes when these programs are launched, the personnel responsible are excited to implement the new strategies but complacency can easily step in. This is when the quality of the results of the program can erode.

Your program may no longer be catching your failures in advance, and this can lead to a loss in production, emergency repairs and even unplanned shutdowns. Performing annual audits on your lubrication program to ensure that it is delivering actionable results is highly recommended.

Many failures and incompetencies can hide behind a “good lubrication program” but with proper auditing and identification of where your lubrication program actually measures up, you can take actions to make it a successful program.

Stay tuned for part 2 where we will be diving deeper into the failure modes that are not being monitored.

The Ideal Lube Room

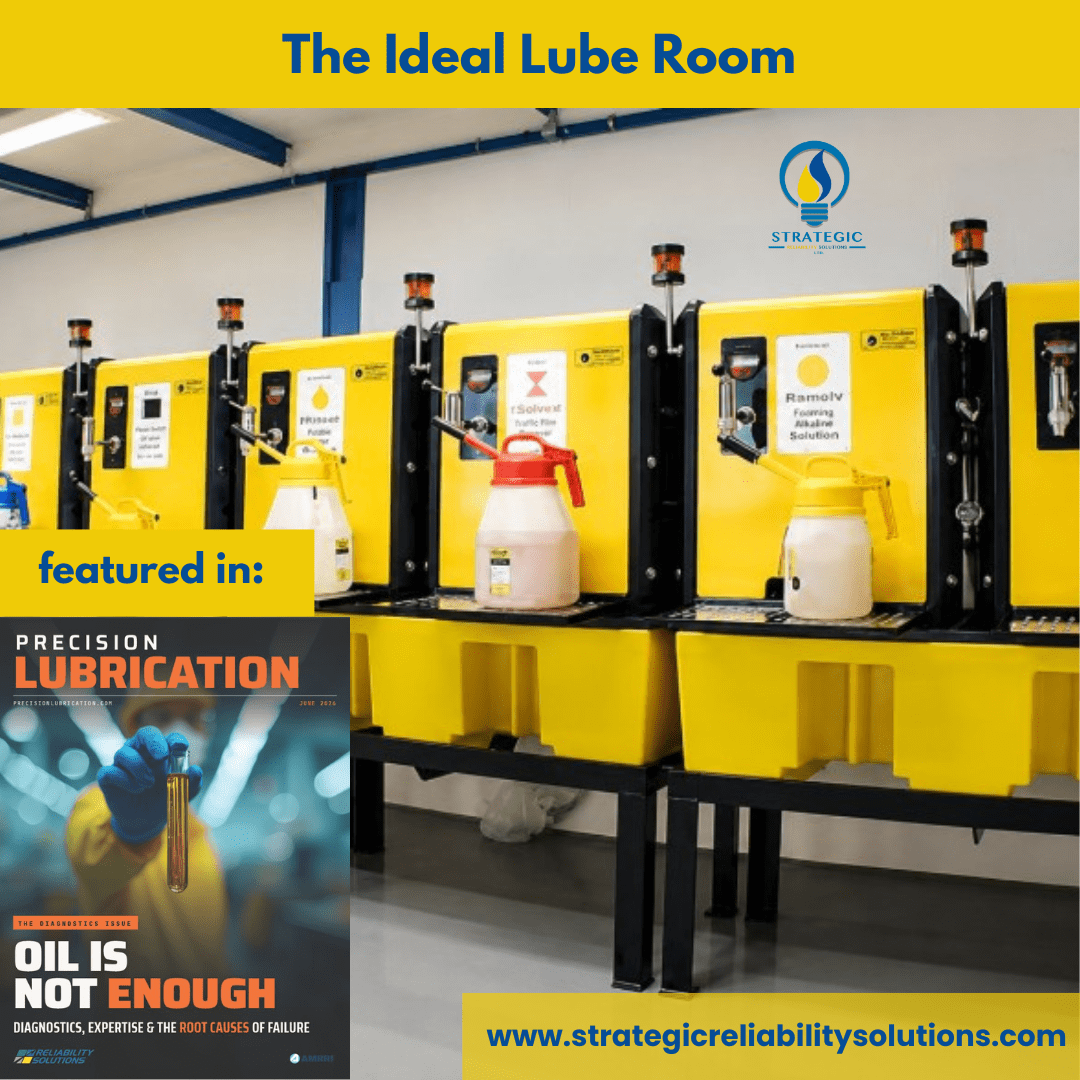
While many may think it is costly or impossible to transform their current lube room, there are a few low-cost adjustments which can be made to help reduce the initiation of failure in this area.

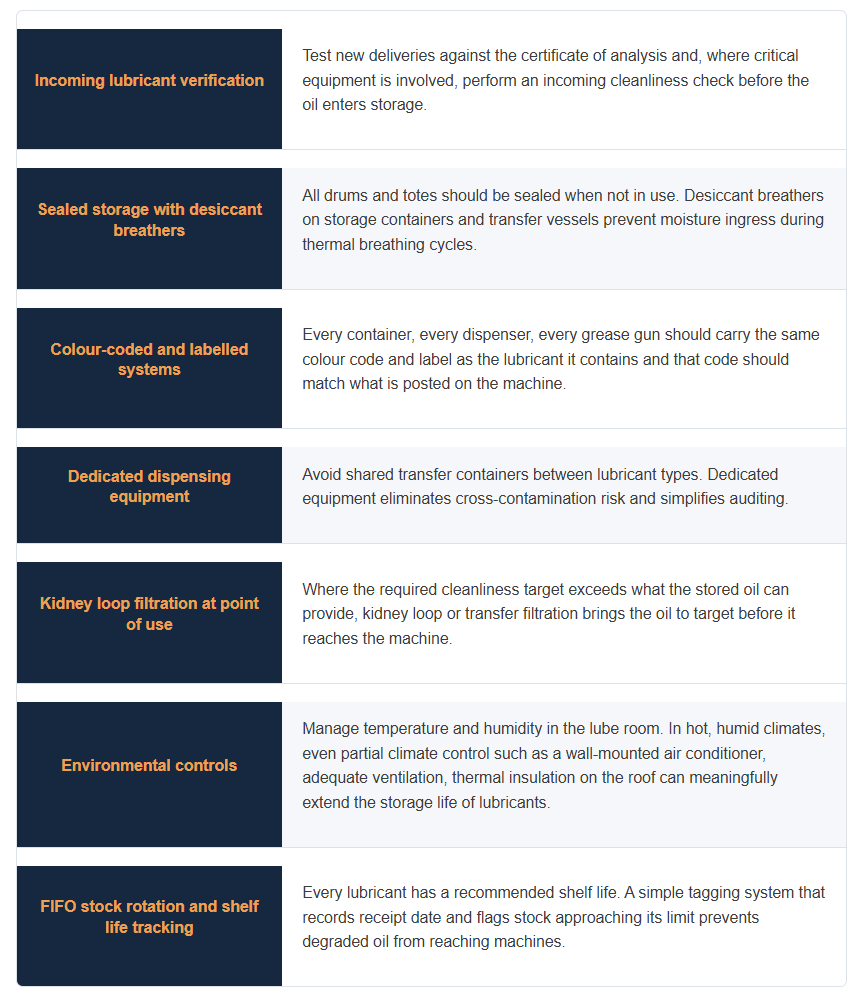
As shown in Figure 2, these small changes can have big impacts on reducing the contaminants which get into the oils before they are added to the machines.

ideal-lube-room
Figure 2: Strategies for an Ideal Lube Room.

By implementing some of the aforementioned strategies, we can see an immediate reduction in the number of failures which occur at a facility. While many think about investing in predictive technologies which may range to the higher cost bracket, these simple adjustments to the lube room can easily solve a large percentage of the issues.

If we were to think about this in terms of the cost of the failures for gearboxes or other critical pieces of equipment, the investment in these strategies to upgrade your lube room is minimal. When investigating your next failure, perform a full root cause analysis and determine whether it’s stemming from your lube room. Chances are that you have the opportunity to prevent a lot more failures than you would expect.

Find out more in the full article, "Why Asset Failures Often Start in the Lube Room" featured in Precision Lubrication Magazine by Sanya Mathura, CEO & Founder of Strategic Reliability Solutions Ltd
Mislabeling and Environmental Conditions in the Lube Room

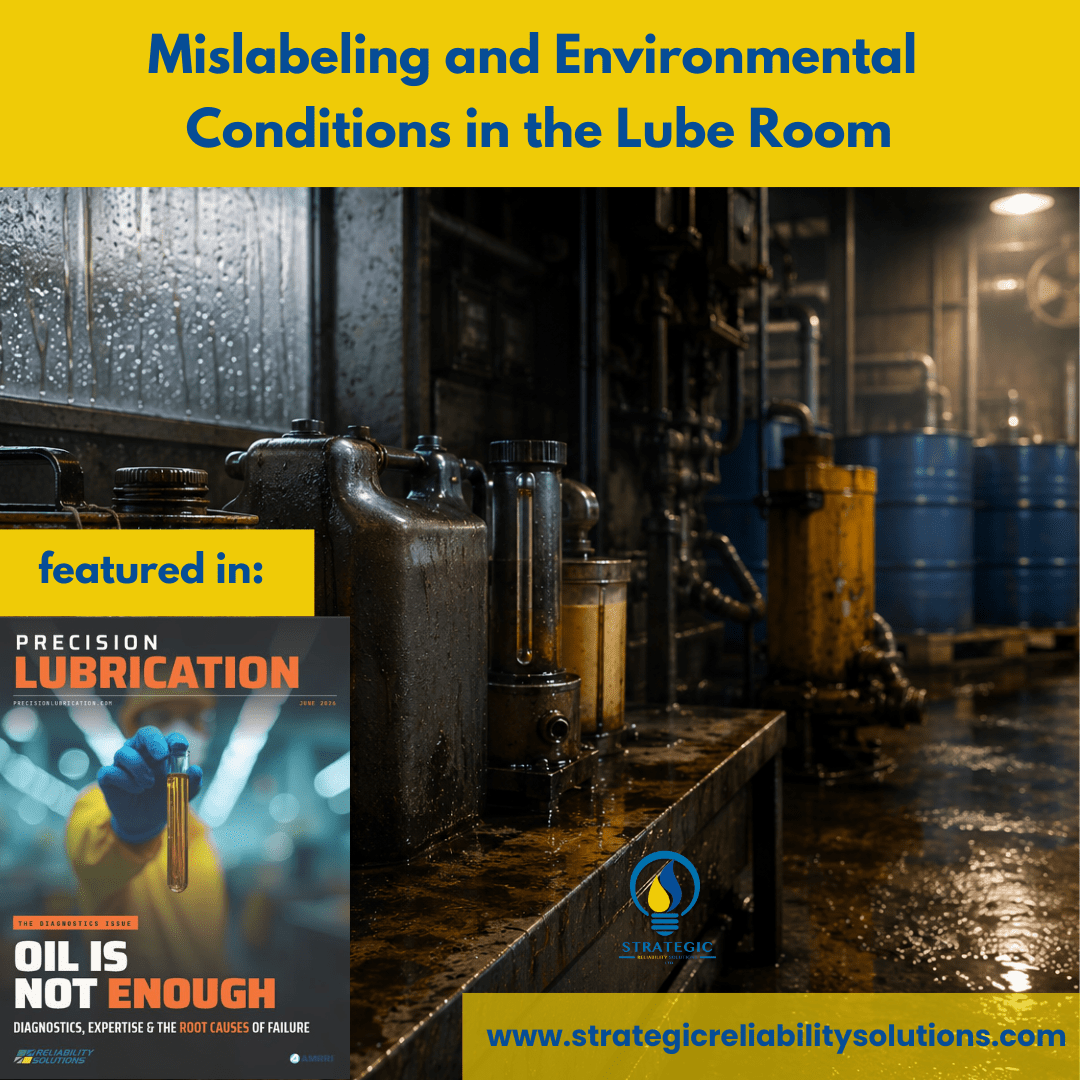
Thus far, we’ve spoken about the effects of mainly physical contamination but quite a number of things also happen in the lube room. One major aspect of compromise is proper labelling of the lubricants. Many times, technicians are in a rush to get their lube route underway and will often not double check that they have the correct lubricant for the application that they are working on. In these cases, they may have picked up the wrong lubricant which is not the appropriate viscosity or suited for the application either!

This can lead to incompatible lubricants being mixed causing a series of failures. It can also lead to incorrect viscosity being applied to the equipment causing wear and tear or efficiency losses. Additionally, if the wrong type of oil is used, this can also lead to severe bleaching of the additives out of the oil.

For instance, if a motor oil (which contains 30% additives) was placed in a hydraulic oil sump, this can lead to catastrophic events where the additives in the motor oil may trap water getting into the hydraulic oil making it emulsify rather than allowing the water to drop out.

As such, we need to ensure that there are adequate labeling systems in place to minimize the occurrence of a mix up with the lubricants. Colour coding can also help as this reduces the errors of “picking up” the wrong dispensing container especially when our technicians are in a hurry.

The environment has a huge role to play regarding the integrity of lubricants. If lubricants are stored outside in drums, they have the tendency to collect rainwater. They can breathe and draw in this rainwater which gets collected at the top of the drum. This breathing action occurs due to changes in temperature such as the change from a bright sunny environment to a rainstorm. This introduces water into the oil and contaminates it before it reaches the equipment. Lubricants should be stored at controlled temperatures between 0–25°C and in a sheltered area.

Find out more in the full article, "Why Asset Failures Often Start in the Lube Room" featured in Precision Lubrication Magazine by Sanya Mathura, CEO & Founder of Strategic Reliability Solutions Ltd
Addressing Contamination in the Lube Room

When we think about the lube room, there can be a few images which come to mind. Either a pristine environment, with everything colour coded, neatly packed on the assigned shelves, dedicated storage and handling containers and a temperature-controlled environment (everyone’s dream!).

Or we can have a mix of dirty, oily rags, creatively designed dispensing containers where the welders were definitely showing off their skills and mislabeled (or no labels) on the lubricants. We can also have many images in between since there is a range of things which can be done (or not done) by those in charge of the lube rooms given their environmental conditions and constraints (budgetary or operational).

Unfortunately, the lube room is the place where many failures can begin if the conditions are not appropriate. It should ideally be the first line of defense for our assets but is often overlooked. Typically, this is the starting point of the journey for any lubricant and if it carries contaminants then we are exponentially decreasing the life of our lubricated assets before they have a chance to operate in our facility. This article explores the ways in which we can reduce these effects and some areas of improvement for any lube room.


Addressing Contamination

The ISO 4406 test is one that the industry is very familiar with as it governs the cleanliness of the oil. Typically, every system / OEM has a targeted cleanliness level. But how does the cleanliness level actually impact the lubricant and its functions? It is often said that the industry runs on a film of oil that is between 1–10 microns. Essentially, that means that any particle which is larger than this range interrupts the film and can cause damage and wear to the components.

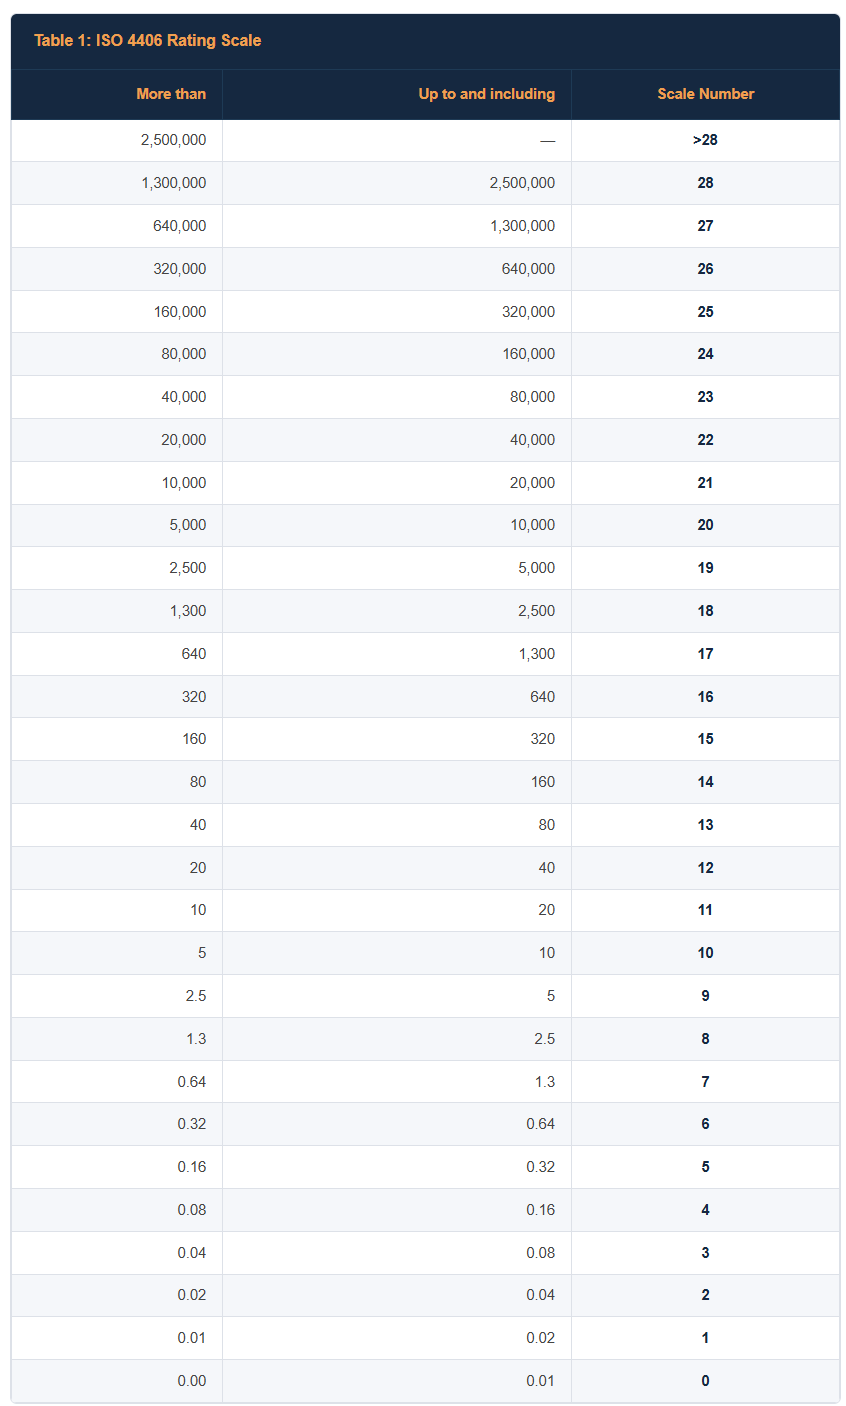
For those not familiar with ISO 4406, this quantifies the number of particles into three categories, ≥4μm / ≥6μm / ≥14μm particles per milliliter of fluid. Each category measures the quantity of particles that fit the size bracket and then these are translated to a scaled number. As such, the numbers represented are not the actual quantity of the particles of that size.

ISO-4406
Table 1: ISO 4406 rating scale.

Therefore, an ISO code of 20/15/13 represents:

20 between 5,000 – 10,000 particles larger than 4μm in one milliliter of fluid
15 between 160 – 320 particles larger than 6μm in one milliliter of fluid
13 between 40 – 80 particles larger than 14μm in one milliliter of fluid

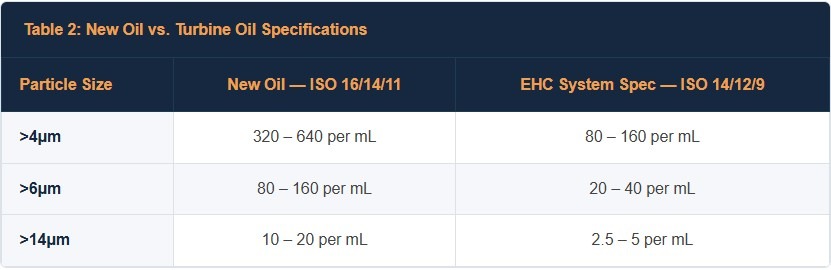
New oil delivery in container sizes between a pail or a truck load, the cleanliness value can be excellent. Sometimes these values can be as clean as ISO 16/14/11, but can also be quite poor. A 16/14/11 score is great, but perhaps our turbines or hydraulic systems particularly those with EHC systems require something more stringent (due to their tighter clearances) such as ISO 14/12/9. The table below shows a comparison of what that actually means as it relates to the number of particles in the oil for these ratings.

table2
Table 2: Comparing new oil to Turbine oil specifications for EHC systems.

As we see in Table 2, there is a major difference between the number of particles at the 4 micron level between what is being delivered to the facility as new oil versus what the turbine actually requires. When we translate that to the fact that bearings in turbines may run on a film of oil which is between 1–10 microns, and our new oil has potentially 640 particles that are bigger than 4 microns, then we can conceptualize that the oil film will most definitely be disrupted!

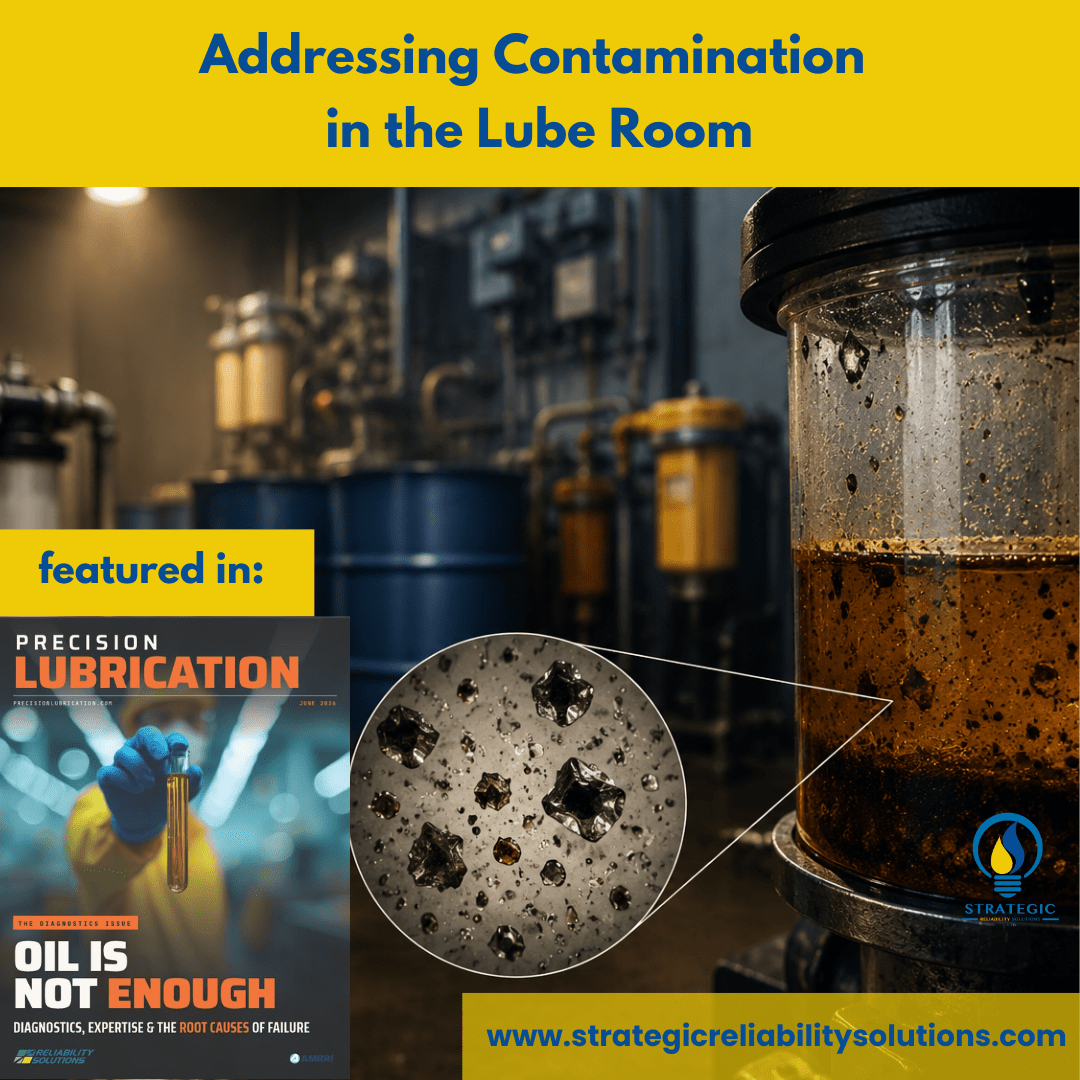
This ISO cleanliness level starts off from the entry of the “clean” lubricant into the plant. If we factor in drums which have been exposed to the atmosphere, dirty transfer containers which already contain contaminants or bad practices (leaving hoses open to the atmosphere), then the ISO contaminant ratings will significantly increase. This means we are literally pouring contaminants into our oils and our assets.

Thus far, we have only described the contaminants in the form of solid particles, but contaminants can also exist in the liquid form (fuel, water, other lubricants, process liquids) or gaseous form (air, process gases). These can all affect the lubricant either acting as catalysts or fouling the system.


The Unseen Failure Chain

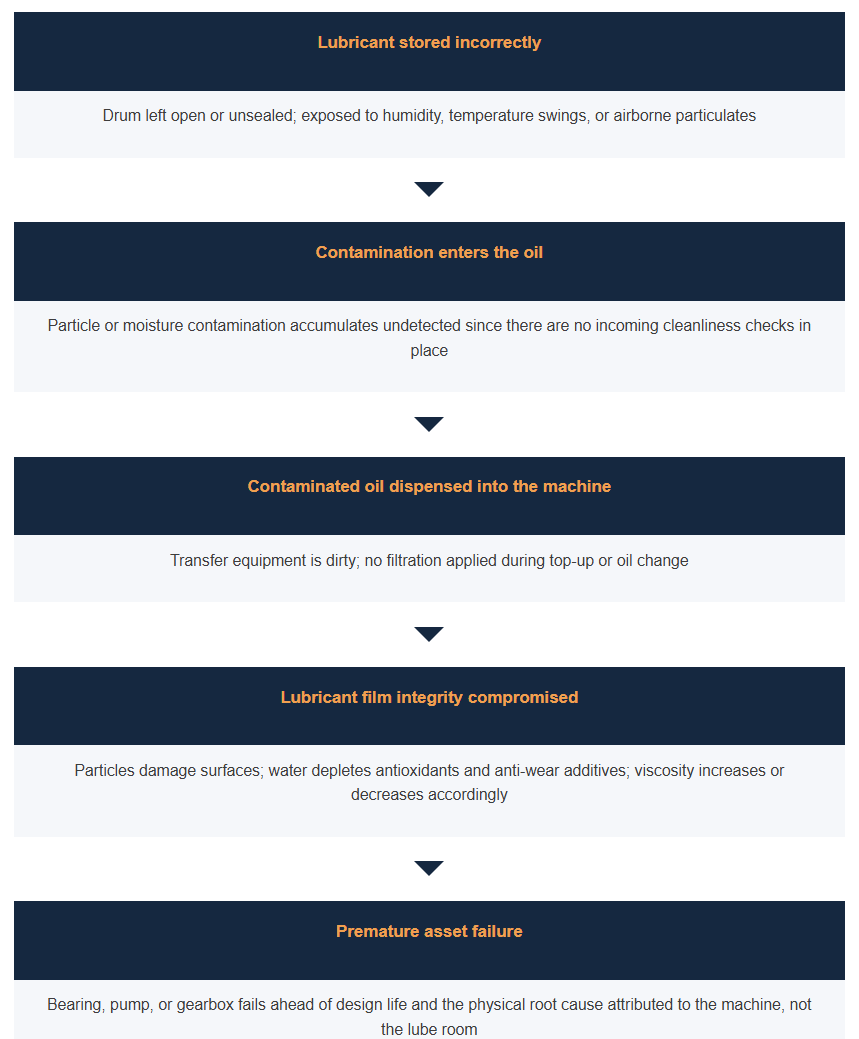
When we think about starting from the lube room and tracing the chain of events which leads to failure, it will look similar to Figure 1 below.

failure-chain
Figure 1: Chain of failure events.

In this case, contaminants start off in the lube room, and they enter the equipment, wreak havoc and then lead to failure. During many failure investigations, the analyst stops at the physical root causes and can easily blame the component. Since they did not investigate further, they missed that the source of contamination actually came from the lube room and possibly bad storage and handling practices.

Find out more in the full article, "Why Asset Failures Often Start in the Lube Room" featured in Precision Lubrication Magazine by Sanya Mathura, CEO & Founder of Strategic Reliability Solutions Ltd
Hidden Failures in Lubrication programs: The Illusion of a Good Lubrication Program – Part 1

Typically, when lubrication programs are developed and implemented, everyone automatically believes that all lubrication issues have been solved and will never occur again. This is furthest from the truth! In this 3-part series, we will explore some of the hidden failures in lubrication programs. We will start off with dispelling the illusion of a good program then dive deeper into the failure modes which are not being monitored and finally, ways to design a resilient lubrication strategy.

How “good’ is good?

Many manufacturing plants have some form of a lubrication program in place. But many are not familiar with how to gauge this against best practices or industry standards. The following figure gives a brief description of the various stages of a lubrication program that can exist.

Figure 1: Varying levels of Maturity for Lubrication Programs

Although many plants may fall within the L2-L4 stages (and some in the L1 stage), there is still a lot of data missing on the documentation on lubrication failures and how these are being addressed (if they are being addressed at all). As such, there are no direct actionable items that link failures to strategies for preventing these in the future.

Industry standards attribute that around 33% of bearing failures are due to lubrication challenges. However, if our lubrication program is not capturing these lubrication related failures then the real root causes are not being addressed directly for these issues. As such, they are not being solved and we are adding to the overall unreliability of the plant. In these instances, our lubrication program is not adding value from a reliability perspective and is actually hiding some failures.

The real failures

Lubrication can account for a significant number of failures, but contamination also plays a crucial role. As per a study carried out by NRCC & STLE (National Research Council Canada & Society of Tribologists and Lubrication Engineers), particle induced failures are responsible for approximately 82% of failures. This means that our equipment is majorly failing because of contamination.

In our “Defined” maturity level 3 program, contamination is not even addressed. Hence, we could be missing the opportunity to remove this from our system and by extension reduce failures associated with contamination. With our level 3 program, we also do not have alarm limits for our oil tests to help us understand if we are approaching dangerous levels or not. This will cause us to miss opportunities where we could have prevented components from failure.

Even with a moderately tiered lubrication program, we are missing a lot of opportunities for improvement of the overall reliability of our plant. This can lead to the lubrication program being viewed as unsuccessful when in fact, it just didn’t capture the right data.

Apart from capturing data, we also need to act on that data. Even if we have an oil analysis program in place, if we are not trending the data or coordinating with our maintenance teams to troubleshoot potential issues, then the lubrication program is not helping to raise the reliability of the plant. The program is in fact hiding some of these inefficiencies.

When was your last audit?

Even though we may have built a lubrication program, have we audited it? Creating a lubrication program may be an easy feat for many but implementing it is another story in itself. This is where some programs fail because they exist on paper but not in practice. If our technicians are not collecting the right data or observing proper storage and handling techniques, then the lubrication program is just another piece of paper in the drawer collecting dust.

For those who have managed to get the lubrication program off the ground and have the right people integrated into it, an audit on the program is still a good idea. Sometimes when these programs are launched, the personnel responsible are excited to implement the new strategies but complacency can easily step in. This is when the quality of the results of the program can erode.

Your program may no longer be catching your failures in advance, and this can lead to a loss in production, emergency repairs and even unplanned shutdowns. Performing annual audits on your lubrication program to ensure that it is delivering actionable results is highly recommended.

Many failures and incompetencies can hide behind a “good lubrication program” but with proper auditing and identification of where your lubrication program actually measures up, you can take actions to make it a successful program.

Stay tuned for part 2 where we will be diving deeper into the failure modes that are not being monitored.

Turning Air Measurements Into Reliability Insight

The Smart Bubble System, developed by Evamo, allows users to gain deeper insight into the behavior of air in their oil. It turns a general volume-based quantification into actionable metrics to improve your system’s reliability and performance. The SBS captures the following metrics:

  • Bubble diameter
  • Air content in your system
  • Bubble count
  • Bubble size-distribution
  • Oil-Air contact surface
  • Transient bubble events

These metrics are directly related to what users see in the field. As such, it closes a gap that many users often experience when relating lab results to field integrations. Users can also trend whether the number of smaller bubbles increased, whether large bubbles began to form in their system, or whether there were transient spikes due to particular conditions in temperature, load, speed, or even return-flow conditions.

Here are a couple of examples that highlight how these values can be interpreted in the field:

  1. If a rise in fine-dispersed bubbles occurs, then this can be indicative of persistent gas transport through the system. This affects the oil’s compressibility and can even lead to a stability issue.
  2. If there is a rise in the number of larger bubbles, this can indicate that there is localized entrainment, return-line impact, free-surface interaction, and stronger ingestion events. If these are not addressed in time, they can damage your components.
  3. If one detects an increase in oil-air contact surface, this can indicate that gas distribution has become more degradation-relevant in the system. This may be despite no dramatic change in the total air content.
  4. If transient bubble events are present, this can directly point to issues related to specific operating states rather than a general system condition that needs to be addressed.
  5. If smaller bubbles occur, this leads to much worse thermal conductivity. As such, higher operating temperatures would need to be cooled down directly with a high amount of energy, or this can lead to a much higher thermal oxidation rate. In each case, the system efficiency is reduced.

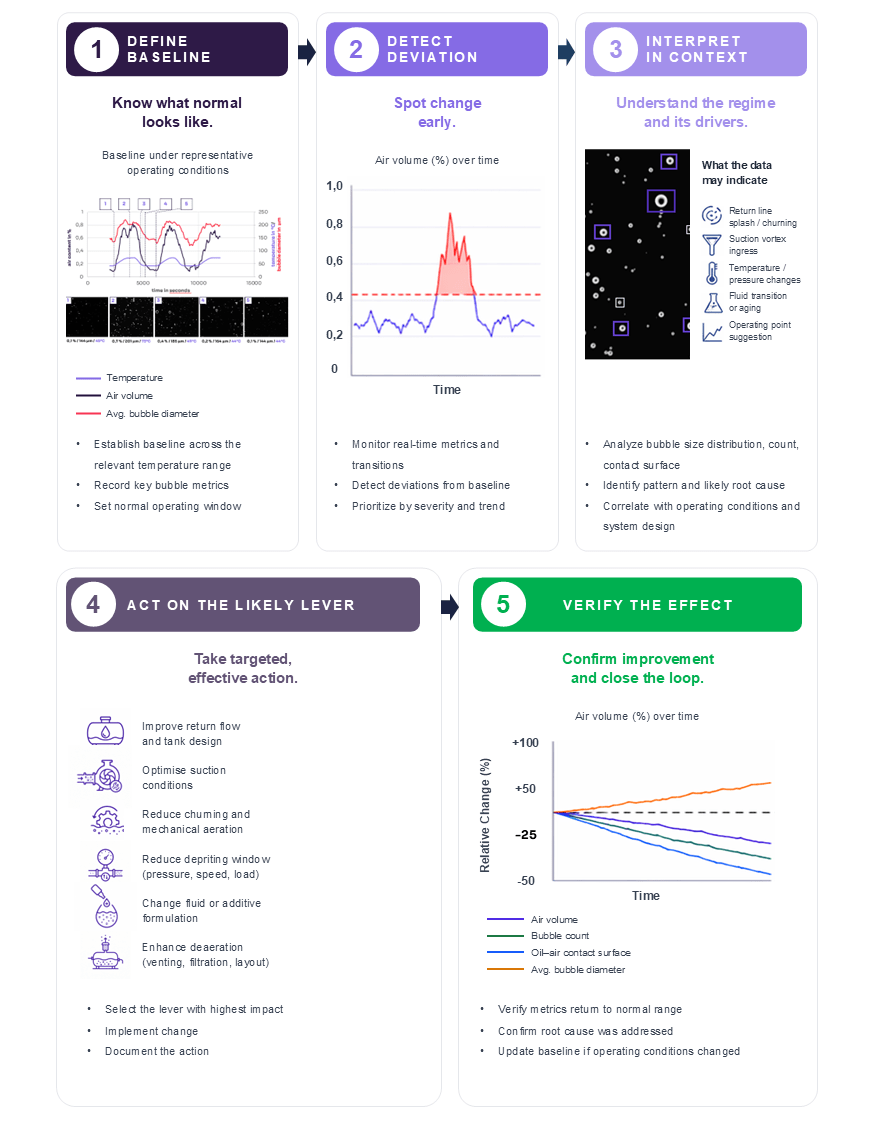
These observations set the stage for more in-depth analysis and contextual interpretation to determine whether the pattern is fluid-driven, hardware-driven, or operating-point-driven. A workflow can be easily implemented to reduce risks to your operation, as highlighted in Figure 3 below.

Figure 3: Suggested workflow for monitoring air in your oil

A robust methodology for the characterization and optimization of your system should follow a structured measurement and interpretation workflow:

  1. Definition of the System Baseline
    The first step is to establish a representative baseline condition by continuously measuring the system’s actual operating state. These parameters should include temperature, rotational speed, torque, flow velocity, pressure conditions, and load states. The baseline must capture the dependency of the oil–air behavior on these operating variables to provide a reliable reference for subsequent evaluations and further steps.
  2. Detection of Deviations and Dynamic Transitions
    Deviations from the baseline are identified using real-time monitoring metrics and transient analysis. Changes in aeration behavior, bubble content, or flow characteristics are quantified relative to the reference baseline state established in Step 1. In parallel, a prioritization strategy should be defined to identify the most critical deviations and focus optimization efforts on the parameters with the highest system impact.
  3. Contextual Interpretation of Deviations
    Detected deviations must be interpreted within the system’s physical context. The origin of the observed behavior should be determined by correlating the measured size distribution and temporal system response with potential mechanisms such as splashing, churning, vortex formation, temperature variations, fluid aging, or changes in the operating point. This contextual analysis enables the differentiation between transient operational effects and systematic design-related issues.
  4. Implementation of Targeted Corrective Measures
    Based on the contextual interpretation, focused and goal-oriented design modifications can be implemented. Possible optimization measures include adjustments to return-flow geometries, improvements in suction conditions, reductions in churning effects, optimization of pressure levels, speed or load adaptations, fluid conditioning, changes to additive formulations, or enhanced filtration strategies. The corrective actions should directly address the identified root causes of the aeration behavior.
  5. Validation Through Continuous Measurement and Improvement
    The effectiveness of the implemented measures must be validated through continuous monitoring and iterative evaluation. Repeated measurements under comparable operating conditions ensure that improvements are sustainable and quantifiable. This closed-loop approach enables continuous system refinement and supports long-term optimization of the behavior of oil–air mixtures.

By moving beyond the standard quantitative measure of air in oil, we can address critical issues occurring in our equipment.  By measuring and interpreting metrics correctly, you can optimize your system’s overall performance, make it goal-oriented, and keep it focused. This supersedes the often-used trial-and-error approach, which can ultimately damage your equipment.

For those interested in taking a more serious approach to understanding the health of their oil and preventing issues before they occur, the SBS can help improve the reliability of their system.

What you see is what you get!

How Is Air in Oil Measured?

When we think about measuring air in oil, the top-of-mind lab tests that are well known are the foam test (ASTM D892) and the Air Release test (ASTM D3427 & DIN ISO 9120). While these two tests can provide information on the tendency of foam to dissipate or for air to be released from the oil, they don’t give the entire story of what’s happening in the oil as it relates to air.

More specifically, they do not take into account the volume of air that can be trapped in your system during operation, nor how long it will take to dissipate when everything stands still. These parameters are critical for determining the impact of entrapped air in your oil.

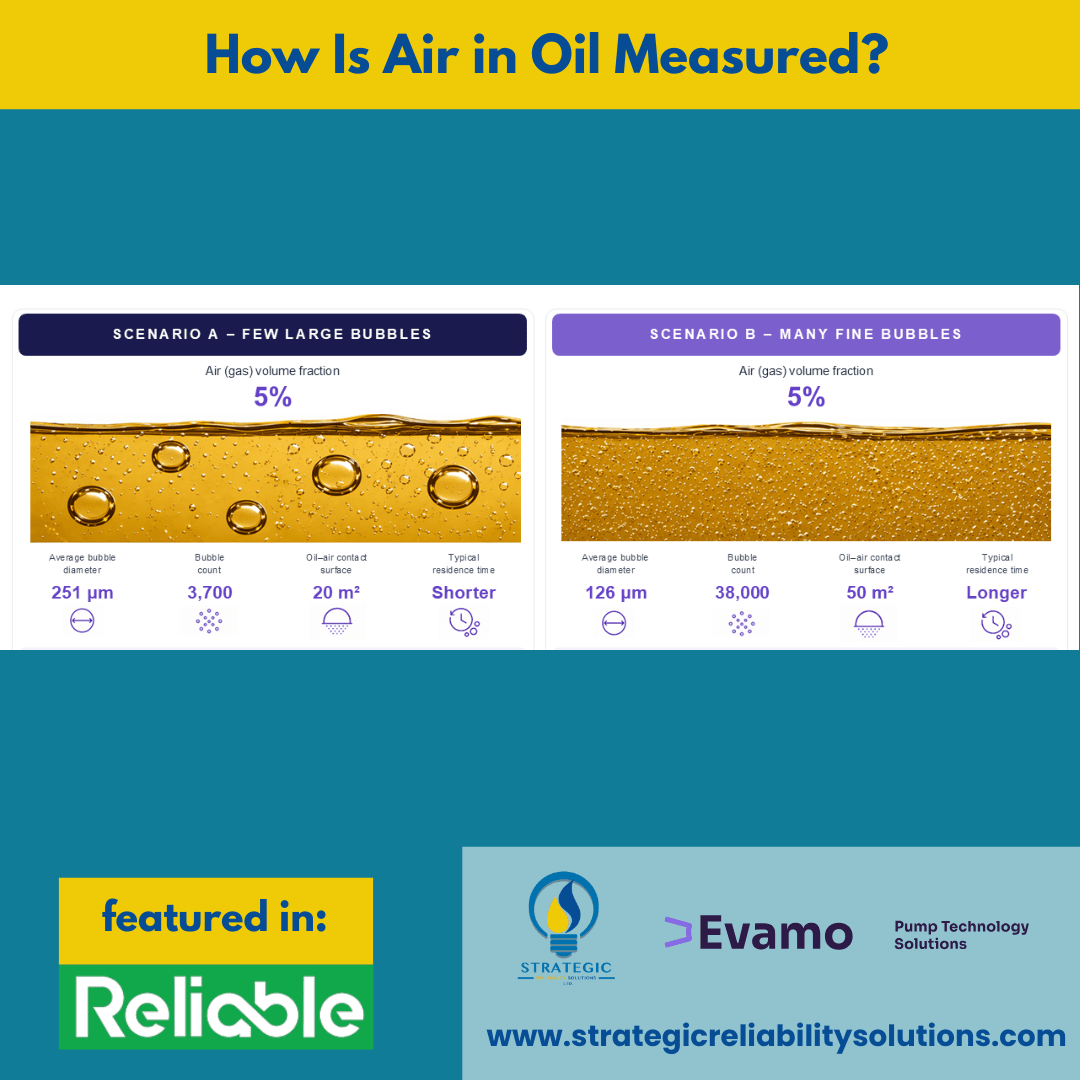
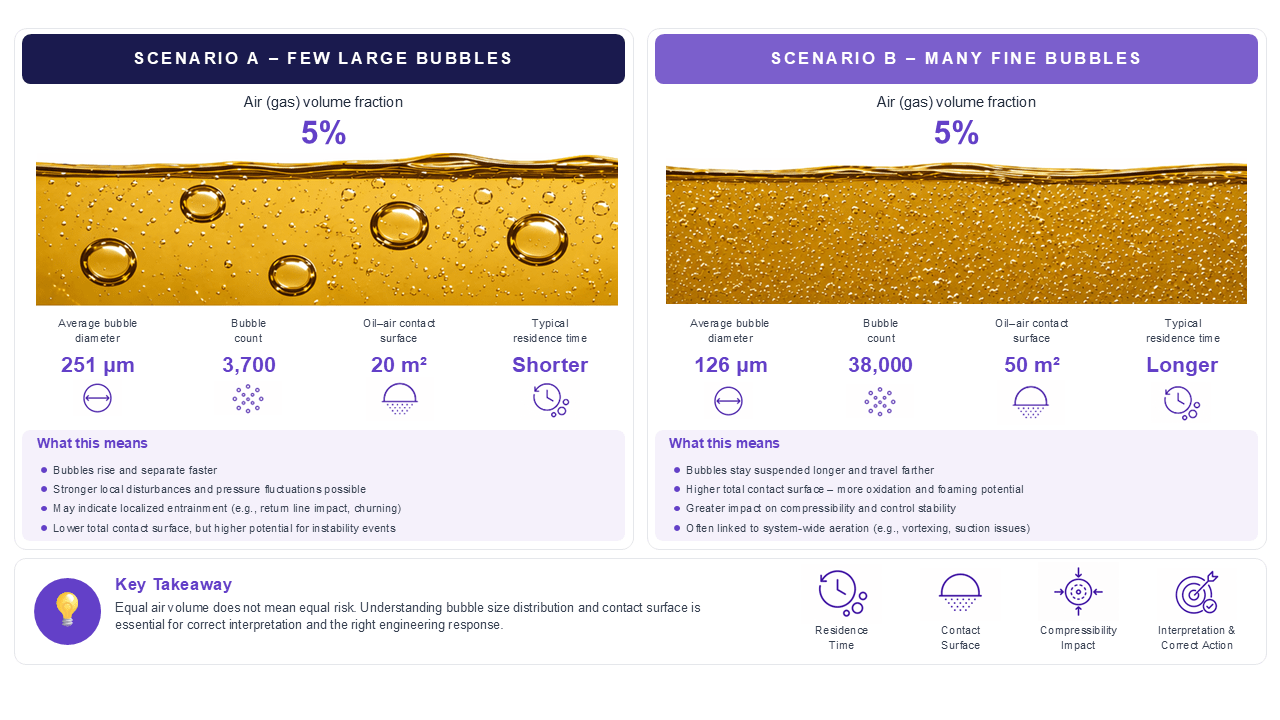
People can also measure the volume of air in the oil, but 5% can mean different things depending on the air’s state, as shown in Figure 2 below.

Figure 2: Scenarios where the air (gas) volume of 5% can mean different things

As we can see in Figure 2, an air (gas) volume fraction of 5% may appear the same, but it can affect your system differently.

In Scenario A, the bubble sizes are larger, so these will rise to the surface more quickly and dissipate. As such, there are fewer disturbances and pressure fluctuations.

In this case, these might indicate localized entrainment, suggesting churning or impact from your return line. Another source could be coalescence, driven by oil properties, splash effects, and other factors. The risk of air bubbles becoming trapped in dead zones increases.

However, in Scenario B, the average bubble size is smaller, which means there are many more air bubbles in the oil! This means that there is a higher surface contact area and an increased potential for foaming. This can increase the rate of oxidation and, by extension, the risk of the oil forming varnish.

This also significantly affects the oil’s compressibility. With the advent of these smaller bubbles, there is usually system-wide aeration, such as vortexing or suction issues. The risk of inefficient cooling and overheating your oil in heaters has increased significantly.

With only a 5% air volume result, we would be missing critical information, such as what could be causing the issue or whether it is an immediate threat to our operations. This is where the SBS (Smart Bubble System) changes the entire game.

The Chemistry Behind Air in Oil

The oil’s chemistry also plays a significant role in determining its air content. All finished lubricants consist of base oil and additives. The characteristics of your base oil can determine important factors such as your viscosity, interfacial behavior, density, and gas solubility. The surface tension of your oil can also be affected by the size of the bubbles and how long they stay in that formation of the bubble.

Depending on the oil application, the appropriate ratios and types of additives vary. As such, there may be more emphasis on certain characteristics such as oxidation stability, viscosity behavior, or foam control. These additives all affect how long air can remain in the oil and the oil’s state, which can affect our machinery.

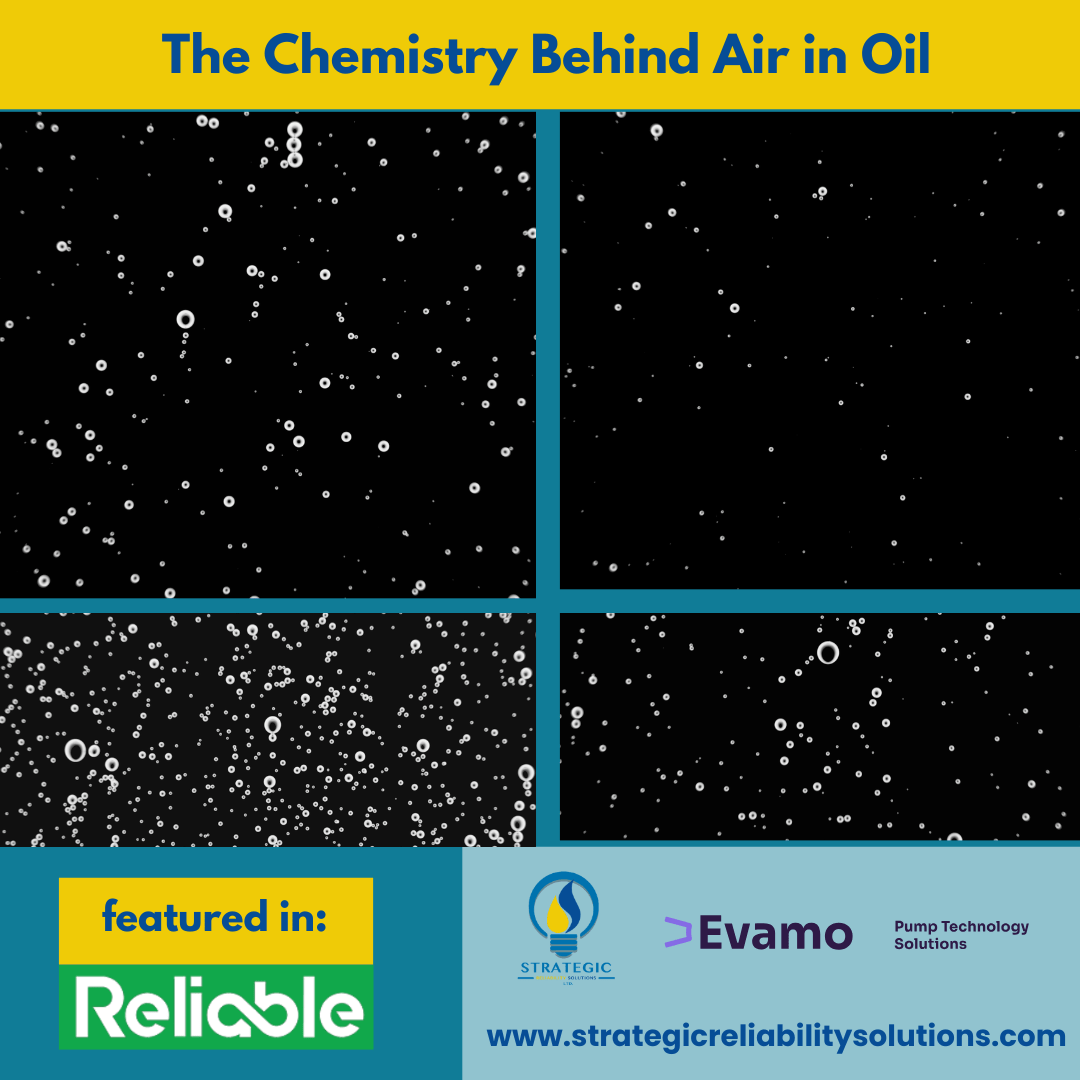
As shown in the video below, we can compare the air content percentage of an oil at varying temperatures and observe significant differences.

As shown in the first video, for a wind turbine gearbox using Optigear Syn CT320, the oil contains less air as the temperature increases, decreasing from 2% at 80°C to 0.7% at 110°C. At 110°C, we see a further decrease in air content to 0.65%. As the temperature starts decreasing again toward 80°C, we observe a volume with 2.2% air content in the oil. This is simply due to a temperature change in the oil, not to any additional air ingress.

As such, for the Optigear Syn CT320 oil in this wind turbine gearbox application, we can conclude that if the oil operates at temperatures around 80°C, we can expect up to 2% air volume in the oil. We observe that for lower temperatures, the air content may increase due to the impact of viscosity on air-release capability.

But if the temperatures increase (to a temperature that is tolerated within the system), then the volume of air will decrease, which is a good thing. However, as temperature increases, your chances of thermal and non-thermal oxidation also increase.

In the video above, we see a completely different behavior with the Fuchs Titan EG ATF D VI oil in an automotive gearbox, which starts off at 45 °C. There is a low air volume in the oil at 0.1%. However, when the temperature reaches 73°C, the volume of air increases by 0.7%.

The air bubbles are much larger, increasing the contact surface and their count within the oil. As the temperature decreases to 49°C, the volume decreases by 0.4%, and the number of bubbles decreases. With the continued drop in temperature to 44°C, the air volume decreases to 0.2% and then tapers off to 0.1%, with smaller, fewer bubbles.

In a wind turbine gearbox application using industrial gearbox oil, we observe that the air content decreases as temperature increases. Conversely, in an automotive gearbox using transmission gear oil, the air content increases with rising temperatures. This is very specific to the oils tested in these examples, as different oils will have varying ratios and types of additives and base oils, which can be affected in diverse ways.

The chemistry of the oil is, therefore, another critical part of understanding the air in your oil. If this is properly understood and measured, it can be very useful for monitoring your oil’s health in the field.