Category: Used Oil Analysis

Sensors vs Traditional Oil Analysis

In this age of AI, it seems that everyone is moving towards sensors and online data. Oil analysis sensors aren’t far behind in this......

Setting Oil Analysis Limits for Diesel Fleets

Setting Up Baselines Global oil suppliers have baseline or tolerance limits that are used when providing guidelines to customers about their equipment. The limits......

What Should be Tracked in Oil Analysis

      Every type of equipment will have different tests that should be performed to monitor its health. We will break down a......

Dangers of Pushing the Limits with Oil Drain Intervals

There is always a danger in pushing limits; that’s why limits exist. They serve as guardrails to ensure that things remain within the standard......

Safety and Environmental Advantages of Extending Oil Drain Intervals

Apart from the financial benefit of extending the oil drain interval, there are also safety and environmental benefits. If these pieces of equipment are......

Financial Gains from Extended Oil Drain Intervals

Before diving further into the condition monitoring aspect, we need to answer the question, “Are there any real benefits to extending the oil drain......

What is Condition Monitoring and Why Is It Important?

In this age of artificial Intelligence and sensors that pop on and off, we often forget about the basics and where things all started.......

Measuring the Success of an Oil Analysis Program

Documentation is always critical especially when we’re trying to build a case to implement some new measures. If previous failures have been documented, then the associated downtime and expenses such as additional labour, parts or expedited shipping and handling should also be taken account of...

Implementing Oil Analysis for a mixed fleet

Ideally, the main objective of this program is to be able to monitor the health of the assets and prevent or reduce the possibility of a major failure or unplanned downtime. While it would be great to monitor the health of all the assets, this may not be entirely necessary...

How to read an Oil Analysis report

While oil analysis can help our teams identify more information about the condition of the oil, we still need to ensure that they can read the oil analysis report and put measures in place to deal with the issues which may arise...

What is Oil Analysis?

Inside the implementation of oil analysis for a mixed fleet of equipment, the impact of this program and ways the success of this method can be measured...

The Hybrid approach – Sensors & Labs

The article by Sanya Mathura and Neil Conway examines the merging both sensors and info from real labs to gauge the health of the oil...

Emerging technology – FluidInspectIR®

The article by Sanya Mathura and Neil Conway examines the emerging technology of FluidInspectIR and gauges its performance against actual lab tests...

Revolutionizing oil analysis: Traditional vs Cutting edge technology

The article by Sanya Mathura and Neil Conway examines the ongoing relevance of oil analysis, highlighting its evolution and current methods. It discusses traditional standards and the need for updates in response to modern equipment demands. The authors emphasize the importance of new technologies in improving the efficiency and accuracy of oil testing processes...

Is Oil analysis still relevant today?

Advancements in AI, machine learning, and sensors complement, rather than replace, traditional oil analysis. While models interpret data, human oversight remains crucial for decisions, especially in novel scenarios. Sensors provide early warnings, but labs ensure precise results. Oil analysis has evolved, using technology to enhance machine reliability and operational efficiency...

Oil analysis vs Other technologies

Oil analysis is akin to blood testing for machines, identifying wear particles and contaminants. Complementary methods like vibration, ultrasound, and thermography assess mechanical issues, providing a holistic view of machine health. By combining these technologies, asset reliability and maintenance are enhanced, leading to more precise diagnostics and better overall equipment performance...

Why oil analysis?

The P-F curve illustrates the expected functional failure point of a component. Among various monitoring technologies, oil analysis is a top method for early failure detection, identifying contaminants and metals. Standards for oil analysis, set by OEMs and bodies like ASTM, ensure global consistency. Reporting formats may vary, but the tests follow the same standards...

What is oil analysis?

Oil analysis is akin to blood tests for the human body, assessing the condition of machine oil and the health of machinery. It identifies wear, degradation, and additive depletion, offering valuable insights for maintenance planning. This process helps operators and maintenance personnel ensure machinery longevity and efficiency. More details are available in Engineering Maintenance Solutions Magazine...

Additives and their properties

Properties of Additives in Lubricants Each lubricant has a varying percentage of additives as not all lubricants are created equally. Lubricants are designed based......

Used Oil Analysis Tips

“When should an oil sample really be taken?” In used oil analysis, oil samples can be taken at any time, but one should always......

Oxidation

What is Oxidation? One of the major types of oil degradation is Oxidation. But what is it exactly, as applied to a lubricant? Oxidation......

ISO 4406

A lot of people get confused when reading the ISO 4406 rating. The rating specifies a range of the number of particles of certain......

Lubrication failures in Ammonia plants

Quite often, when lubrication failures occur, the first recommended action is to change the lubricant. However, when the lubricant is changed, the real root......

Lubrication failures in Industrial plants

When failures occur in industrial plants, the first culprit to be suspected is usually the lubricant. However, should this be the first area that......

How can a lubricant fail?

How can a lubricant fail? This question has caused many sleepless nights and initiated countless discussions within the industrial and even transportation sectors. Before......

No post found

Sensors vs Traditional Oil Analysis

In this age of AI, it seems that everyone is moving towards sensors and online data. Oil analysis sensors aren’t far behind in this revolution. There are mid-infrared sensors that have been engineered to relate their findings to those of regular oil tests (developed by Spectrolytic). While sensors are the way of the future, the fundamental concept remains the same. What are we doing with the data, and what data are we trending?

Sensors deliver speed, but proven lab methods still set the benchmark for accuracy.

Traditional oil analysis labs trend data, albeit the frequency of the data points is not as high as that of an online sensor. Hence, subtle/instant changes may not be readily noticed or detected. The methods used in these labs have been tried and tested over the years (and approved by various standards committees) to reflect conditions that the oil is facing in the field.
On the other hand, in the sensor world, not many of them (with the few exceptions) correlate exactly to what is being seen in the field. Hence, some lab tests, especially for the specialty tests such as RULER, MPC, and TOST (mainly for turbines), still need to be done by the lab. This is a great opportunity for traditional labs and sensor companies to collaborate and provide customers with collated data.

Moving Towards Sustainable Maintenance

While this article explicitly discusses extending the oil drain intervals for your assets, it underscores the importance of working alongside maintenance and condition monitoring to achieve these results. There is no clear cookie-cutter routine to achieve this, as each fleet of assets will be different and require varying levels of complexity for analysis. One thing is clear, though: we need to move towards sustainable maintenance.

Performing maintenance in the traditional way of just waiting for the appointed interval may be costing us increased labor and parts. However, by working alongside maintenance and condition monitoring, we can get more value from our assets and even increase our ROIs. Sustainable maintenance is the way forward for most asset owners as we move into a new era of maintenance.

Setting Oil Analysis Limits for Diesel Fleets

Setting Up Baselines

Global oil suppliers have baseline or tolerance limits that are used when providing guidelines to customers about their equipment. The limits for a gearbox will differ from those of an engine. For instance, an iron content level of 3000ppm is normal for an automatic transmission gearbox but highly irregular for a diesel engine! Hence, it is important to know the limits associated with the application.

Some labs have also developed their own set of limits based on years of collecting hundreds of samples and liaising with their customers in the field. OEMs have also developed their own sets of limits (usually displayed in their manuals) based on their testing in the lab and on the field.

Knowing your own “normal” is more valuable than any generic industry limit.

Ideally, when developing your target levels, you should trend your data and find out what “normal” looks like for your equipment. In some cases, what is normal for your environment may be abnormal in a different environment. But it is important to note when normal varies from standard operating tolerances. This is where you would want to work together with your oil supplier, lab, and OEM to develop tolerances that align with your equipment.

Depending on your maintenance program, you can also adjust the tolerance accordingly. If you are aware that maintenance may not act on a threshold limit right away, it may be a good idea to add some padding to those limits. This ensures that the equipment does not suffer by pushing it to the limits.

Setting Oil Analysis Limits for Diesel Fleets

Let’s explore how to set the limits for a diesel engine fleet of trucks.

First, let’s categorize the trucks into critical, semi-critical, and non-critical.

The critical ones are those that, if they break down, there is no replacement; the downtime hurts us financially and can delay the project. These need to be available 24/7.

The semi-critical ones are those that still have an impact on the operation if they break down, but it’s not quite as disastrous. These can be trucks that are not on tight deadlines, can afford to have some leniency or delays with their workload.

The non-critical trucks are those that can be easily swapped out for another truck without causing any delay or impact to the project, but they are still important.

Now that these are categorized, we need to find out what types of engines are being used and what the recommended diesel engine oils are for these units. Typically, most operators have mixed fleets. Thus, one may see a wide age/mileage gap in the engines. This gives us an idea of the reliability of the engines, which can impact the setting of the tolerance limits.

Since it’s a diesel engine fleet, it would be worthwhile to consider the type of fuel being used for this fleet. With diesel engines, there are varying levels of sulphur in the fuel, which can impact the oil drain intervals as well.

For this fleet, we may need to establish varying oil drain intervals to ensure maximum reliability, based on the categories outlined by their criticality. Before adopting set oil drain intervals, it is important to execute a pilot project with the fleet to anticipate any rollout challenges for the future. We will discuss these in more detail in the case study section.

Real-World Results from a Diesel Fleet Oil Analysis Program

Fleet: Mixed long-haul trucks of various ages/mileages

Predominant oil: Mineral 15w40 Diesel engine oil (CI4 spec)

Regular Oil Drain Interval: 3000km (based on best practice over time)

Approach: An engine asset list was first compiled for every truck in the fleet. This follows the table below:

Table 1: Sample of Engine Asset listing for Mixed long-haul fleet

It’s important to have a column for comments as this can capture some data that we may not be aware of, such as a recent engine overhaul done to the unit, or the driver has regularly lost power over the past few weeks, or the driver tops up the oil every time he gets back to the yard.

These little details may not be captured in the CMMS (if one exists) or the maintenance logs, but they are crucial in determining whether we can safely extend the oil drain intervals or not. For units that require special attention or are under warranty, these may have to be excluded until more favorable conditions exist.

Based on the fleet (15 trucks), they were categorized into three main groups:

Critical – these units were being used every day on projects that had tight deadlines. They were often unavailable to return to the yard for maintenance or oil changes, as each hour away from the job affected the project deadline.

Semi-critical – these units were utilized by various customers at distant locations and often spent most of their time at the customer site (due to the distance). Hence, basic maintenance was usually performed at the customer’s site, causing minimal disruption to the operation.

Non-Critical – these units are often deployed in situations where extra assistance is required, or they are the standby units if one of the critical units is in trouble.

Even though they had these three groupings, the engine types and mileages were very varied. Hence, a matrix was formed for this fleet.

Table 2: Criticality Matrix – Long-haul fleet

The majority of the fleet falls within the 20-100,000km range, spanning across the critical, semi-critical, and non-critical categories.

A pilot test was done on the following:

  • 3 of the critical units within the 20-100,000km range
  • 1 semi-critical unit in the >100,000km range
  • 1 non-critical unit in the > 100,000km range

Since the typical oil drain interval was 3,000km, we took samples at 1500, 2000, 2500, and then again at 3000km. Based on the trend observed from the first 3 samples, we had a fair indication of the condition of the oil before it got to 3000km.

None of the samples showed any unusual signs of wear, excessive additive depletion, or ingress of contaminants. For these samples, we kept a close eye on maintaining the following parameters:

Table 3: Suggested Parameters to monitor for fleet

Samples were then taken at 3500, 4000, 4500, 5000, 5500 & 6000km. Then, another set of samples was taken at 6500, 7000, 7500, and 8000km once the oil analysis values were still within range. The aim was to at least double the oil drain interval for this fleet.

Intervals of 500km were used as a cautionary value to allow enough time for any anomalies to be caught. The critical engines got to these values faster than the semi-critical and non-critical units.

All of the critical units easily got to 9000km without any of the oil analysis values entering the warning zones. However, the semi-critical unit, which had exceeded 100,000km, only made it to 8,500 km before the TBN and fuel dilution values entered the warning zone. The non-critical unit, which exceeded 100,000km, also reached 9,000 km without any issues.

Since the owner wanted to be on the side of caution (and allow some wiggle room between the intervals for trucks which could not get maintenance done at the specified interval), they chose to change the oils across the fleet at the 7500km mark but keep the oil analysis program where they perform samples at 4000 & 7000km.

They will now work alongside oil analysis, and for some trucks, where they believe they can have an even longer interval, they will extend it accordingly.

What does this mean?

These engines take approximately 44 quarts or roughly 42 liters of oil and are changed every 3000km or roughly 2 months (critical units) with an average of 3 hours downtime for the oil change.

Hence, one unit undergoes approximately six oil changes per year:

  • An average of about 3 hours x 6 times = 18 hours downtime
  • An average of 42 liters x 6 times = 252 liters changed per year
  • Thus, for six critical units that would be:
  • Downtime => 18 hours x 6 units = 108 hours
  • Oil consumption = 252 liters x 6 units = 1,512 liters

The new oil drain interval of 7500km resulted in a 2.5-fold increase in the interval.

This means that the new interval would be every 5 months instead of every 2 months.

Thus, these six units would only do oil changes twice for the year.

New downtime = 3 hours x 2 times/year x 6 units = 36 hours / year

New oil consumption = 42 liters x 2 times/year x 6 units = 504 liters

The following table summarizes the changes.

Table 4: Comparison with extended oil drain interval (ODI)

This is just for part of the fleet, and a dollar value has not been assigned to these, but clearly, there are lots of benefits to extending the oil drain interval through guided oil analysis.

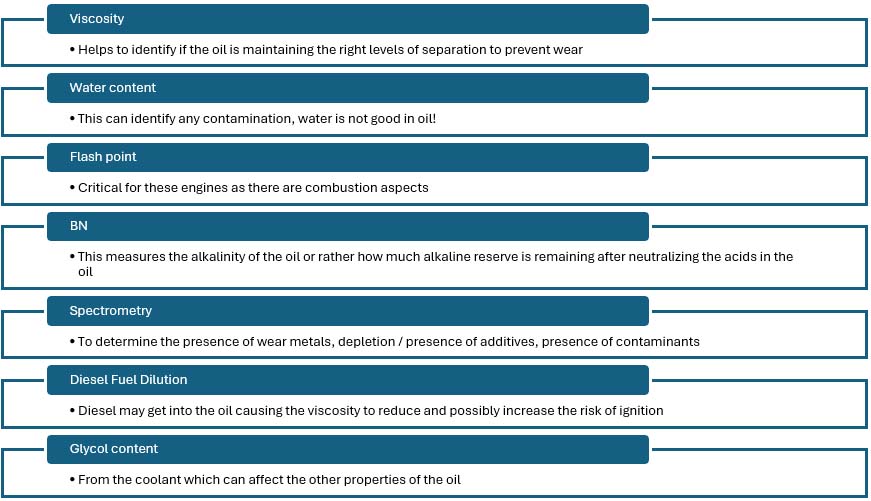
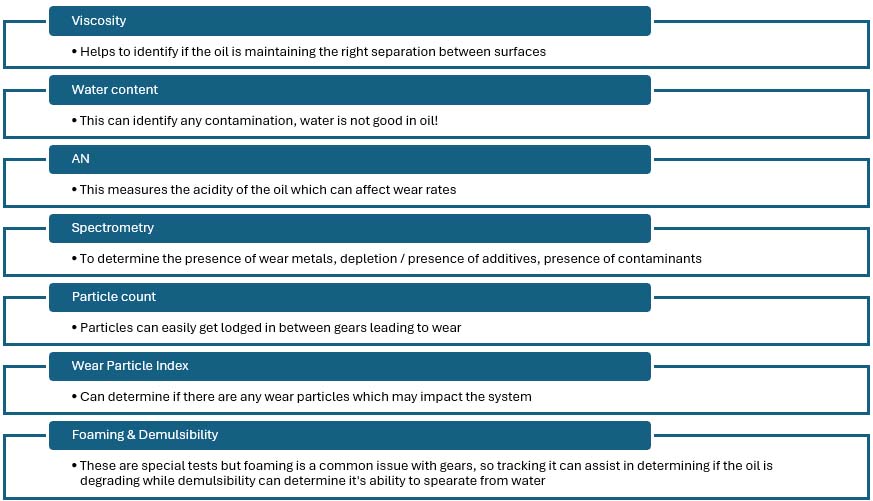
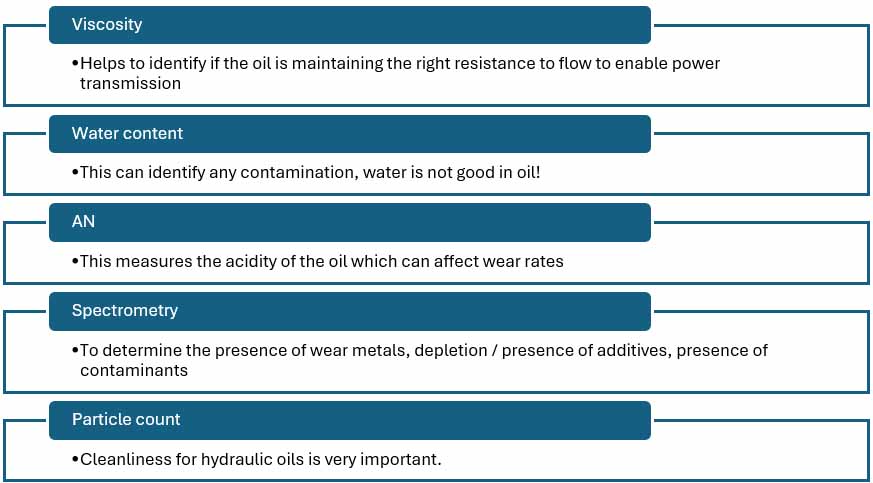
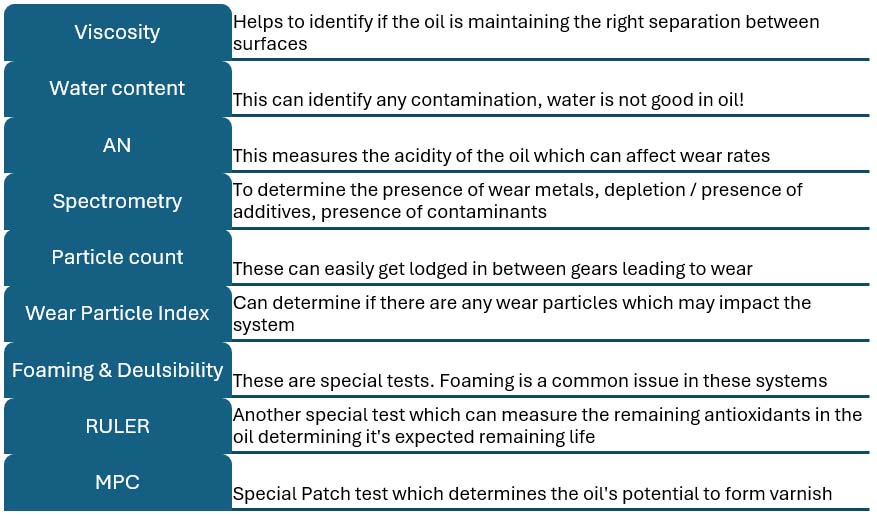
What Should be Tracked in Oil Analysis


Every type of equipment will have different tests that should be performed to monitor its health. We will break down a few common types and the associated basic and some specific oil analysis tests that should be performed.

Diesel/Gasoline Engines (can be further broken down into on-road, stationary, aviation, landfill, and marine)

Basic (monthly tests)

diesel-gasoline-engins

Gearboxes (can be broken down into industrial or automotive)

gearboxes

Hydraulics

hydraulics

Turbines and Compressors

turbines-compressors

We did not dive into Electrical oils, heat transfer oil, circulating oils, metalworking fluids, or seal oils, but these will have similar type tests and some special tests as well.

Dangers of Pushing the Limits with Oil Drain Intervals

There is always a danger in pushing limits; that’s why limits exist. They serve as guardrails to ensure that things remain within the standard envelope. As it applies to oil analysis, there are some dangers if the limits are not addressed.

Typically, maintenance intervals are determined by the number of hours worked or the mileage of equipment. These guidelines were developed by OEMs (Original Equipment Manufacturers) based on lab and, in some cases, field tests. Usually, these limits are set with some tolerance for “marginal error,” where the oil may not be changed exactly at the specified interval. However, nobody states what those margins are or what tolerance limits can be used.

In these cases, the oil, whether it has reached the end of its useful life or not, is changed in an attempt to protect the equipment from failing in the future. Hence, OEMs always recommend staying within the limits, as those are what they can guarantee / warranty. Pushing the limits may mean getting in a bit of trouble with your OEM, and they may void your warranty. However, if the benefits outweigh their concerns, then it may be time to push those limits.

Safety and Environmental Advantages of Extending Oil Drain Intervals

Apart from the financial benefit of extending the oil drain interval, there are also safety and environmental benefits. If these pieces of equipment are in high-risk areas, then the humans involved in changing the oil would be placed at risk during these times.

If the oil drain interval is extended, then the humans performing these operations will have reduced hours spent in these high-risk areas. As such, it will limit the number of risk-hours and possibly lower the LTI (Loss Time Injuries) or occurrence of any such safety incidents.

Fewer oil changes mean fewer hours in hazardous zones – and fewer chances for accidents.

Every time the oil is drained from the sump, it must be disposed of safely. Typically, worksites have a dedicated area in which the used oil is stored until it is collected by a disposal provider. Some providers may charge based on the volume they collect or the frequency at which they service their customers. However, the oil must still be disposed. With longer oil drain intervals, there is a reduced volume of used oil collected by these suppliers.

Additionally, longer oil drain intervals also impact the consumption of new oil for these systems. Therefore, equipment owners would likely see a decline in the volumes of oil purchased. This also translates to a saving on the environment as resources used to create new oil are also now reduced, or rather, the demand may be reduced overall.

Another benefit of extended oil drain intervals is that the equipment is available for a longer time. This can become critical in some jobs where the equipment is needed 24/7 or even for an emergency. The availability of equipment can also translate into the potential saving of a life (depending on the equipment).

Overall, there are financial, safety, and environmental benefits to extending the oil drain interval for equipment.

Financial Gains from Extended Oil Drain Intervals

Before diving further into the condition monitoring aspect, we need to answer the question, “Are there any real benefits to extending the oil drain interval of a piece of equipment?” The answer depends on the criticality of the equipment and the cost associated with its downtime.

Financial Gains from Extended Oil Drain Intervals

For critical equipment where maintenance downtime hampers production or availability, extending oil drain intervals offers tremendous financial benefits. For every oil drain interval, there are associated costs such as manual labor, cost of supplies (filters, new charge of oil), and disposal of used oil, to name just a few.

Every unnecessary oil change wastes labor, materials, and money that could be invested in reliability.

Depending on the size of the sump, costs can escalate, particularly if cleaning is required before the new oil charge is placed into the equipment. Different types of applications will advise the draining of the sump and refilling with new oil, while others recommend that the sump be flushed or manually cleaned before the new oil is administered.

Additionally, if the used oil becomes heavily contaminated during use, the sump and entire system would need to be cleaned thoroughly before new oil is used.

What is Condition Monitoring and Why Is It Important?

In this age of artificial Intelligence and sensors that pop on and off, we often forget about the basics and where things all started. Condition monitoring began as a way to detect anomalies in our equipment using various types of technologies. These include: vibration, ultrasound, infrared, oil analysis, and even temperature.

These were all conditions that were “aligned” with what was happening on the inside of the machine. As such, changes in their values usually indicated that something was occurring, but it was up to the trained analyst to determine if that was a good thing or a bad thing.

The most effective reliability programs blend multiple condition monitoring technologies to catch failures before they happen.

For this article, we will focus heavily on oil analysis, but this does not mean that it’s the only technology that should be used for monitoring your equipment. It has been proven that a combination of technologies can maximize the opportunity to detect an impending failure earlier and allow the maintenance team to act/plan accordingly. This can save millions of dollars depending on the industry and the type of equipment.

Using Oil Analysis as a Core Condition Monitoring Tool

Stated, oil analysis can be any test performed on the oil that has been in use in the system. It is essential to note that the oil sampled should be representative of the system; otherwise, the results can lead to operators making inaccurate decisions.

For instance, oil taken from a dead leg of the equipment or in a stagnant zone does not truly represent the oil in the system. This can give a false representation of the system and cause misdiagnosis.

Depending on the equipment being monitored, specific tests would be required to determine the health of those systems. For example, with a turbine oil, one specific test would be the RULER® test to determine the remaining useful life (in the form of antioxidants).

However, if this test were performed for a transformer oil, it would not provide the operator with the necessary information, and more aligned tests such as Viscosity, Dissolved Gas Analysis, or Flash point would be more suitable.

Measuring the Success of an Oil Analysis Program

In a world where budgets rule the day and any additional program is shut down if merit cannot be found in it, being able to prove the success of your oil analysis program is critical. But how does one go about proving that the implementation of a program has stopped or reduced failures when there isn’t a big incident to compare it against? Simple, we start in the past to get to where we need to be in the future.

Documentation is always critical especially when we’re trying to build a case to implement some new measures. If previous failures have been documented, then the associated downtime and expenses such as additional labour, parts or expedited shipping and handling should also be taken account of. By detailing the costs associated with a failure or unplanned downtime from a lubrication issue, we can use this data to help determine the ROI of implementing the oil analysis program.

We need to then identify the times that the oil analysis program alerted the maintenance team about an upcoming issue or something that didn’t seem right which turned out to be a failing part or perhaps something that would cause some unplanned downtime. In these cases, we need to note what challenge we stopped or reduced the risk of occurring. By assigning a value to the failure that we prevented, we can then develop the ROI on the implementation of the oil analysis program.

Oil analysis can be a game changer for our maintenance teams in our fleets. It can help them to make more informed decisions allowing them to plan maintenance activities better and even reduce unwanted downtime. Oil analysis can be that hidden tool in our utility belt if we make use of it and implement it to help our fleets.


References

Bureau Veritas. (2020). The Basics of Oil Analysis Booklet. Retrieved from Bureau Veritas: https://oil-testing.com/wp-content/uploads/2020/08/Basics-of-Oil-Analysis-Booklet-2020V_compressed-1.pdf

Rensselar, J. V. (2016, January). Unraveling the mystery of oil analysis flagging limits. STLE TLT magazine.

Implementing Oil Analysis for a mixed fleet

Now that we understand the value that oil analysis can bring, we need to be able to implement it, especially in mixed fleets. It is critical to clearly define the objectives of this program to ensure that we can monitor the value that oil analysis brings to our operations.

Ideally, the main objective of this program is to be able to monitor the health of the assets and prevent or reduce the possibility of a major failure or unplanned downtime. While it would be great to monitor the health of all the assets, this may not be entirely necessary.

Assets can be broken down into three main categories: critical, semi-critical and non-critical. The critical assets are the pieces of equipment which if they fail, can negatively impact the business. Semi-critical assets are those which if they fail, may have some impact on the business while non-critical assets are those whose failure do not impact on the business.

Depending on the nature of the business or the operations / projects which are ongoing at any point in time, your critical assets can switch in terms of priority to become semi-critical or a non-critical asset. For instance, if there was a job which required the use of a crane, then this would be our critical asset. However, if there was a job which did not require the use of a crane, then this asset becomes non-critical.

If we were dealing with the manufacturing industry where there are stationary pieces of equipment and a standard procedure, then the criticality of assets will not change as compared to a mixed fleet operation where contractors may have different jobs and require varying pieces of equipment.

Now that we’ve identified the critical assets / pieces of equipment, the sampling frequency must be determined. For critical assets, these may require some specialty tests as we want to ensure that we are alerted at the earliest possible time about an impending failure.

(Bureau Veritas, 2020) provides some guidelines for oil sampling as per figure 4 below. However, the OEM guidelines should be adhered to once they exist. Even though the sampling intervals state 250 or 500 hours, these must be in accordance with the OEMs guidelines regarding maintenance as well.

Figure 5. Guidelines for sampling as per Bureau Veritas, 2020

Typically, some OEMs may require an oil change at around 500 or 1000 hours (depending on the unit). If we only take the oil sample at the end of the life of the oil, then we are monitoring and trending how the oil ages at this point in time. However, if we’re trying to extend the oil drain interval of a component, then we would need to develop shorter intervals to monitor how the health of the oil is progressing and if it can indeed last for a longer time. If we’re attempting to extend the oil drain interval, then this should be done at increments of about a quarter of the usual interval.

How to read an Oil Analysis report

While oil analysis can help our teams identify more information about the condition of the oil, we still need to ensure that they can read the oil analysis report and put measures in place to deal with the issues which may arise. In the example below, we will look through a typical diesel engine report as provided by ALS Tribology lab featured in STLE’s TLT magazine as shown in Figure 1.

Figure 1. First page of Diesel Engine oil report adapted from Rensselar, 2016

Most labs try to make it very easy for the report readers to assess the health of the oil, at a first glance. They usually implement a traffic light system where the status of the oil is highlighted. In this case, this oil has a normal rating indicating that the oil is still in good health and there isn’t anything to be concerned about yet as shown in Figure 2.

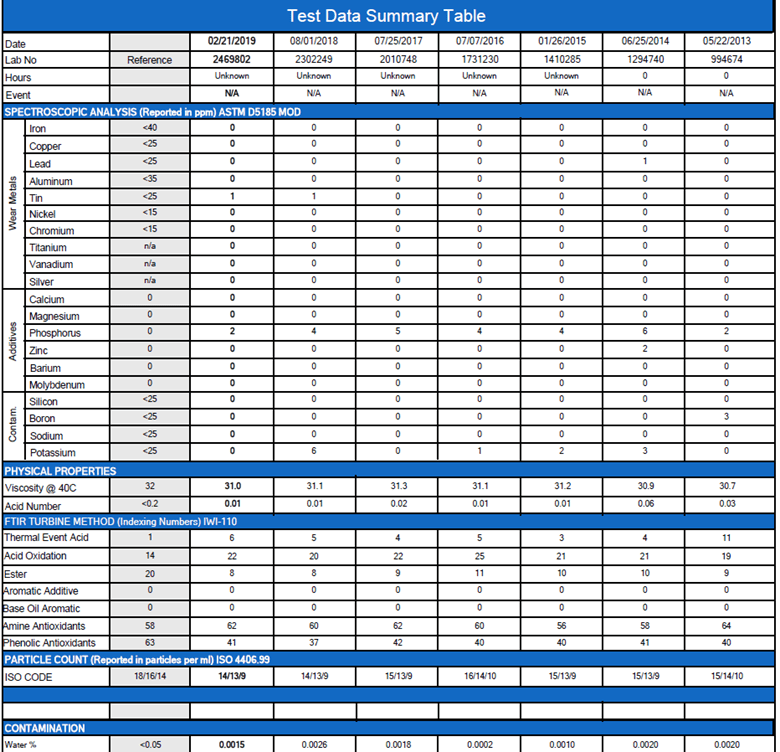
However, one of the main premises of oil analysis is the ability to spot trends over time and from this report, we can see that the oil may not have always been in a good condition as shown in figure 3. Each column represents an oil sample from a different date, so at a quick glance we can see that for two of the results, the oil was not in a good state whereas for the other results they remained in the normal region.

Figure 3: Changing condition of the oil
Figure 2: Current condition of the oil

One question that often gets asked is, “What is the normal region?”. Most oil analysis labs have collected data from OEMs which explicitly state the alarm limits for their pieces of equipment. As such, for each component, a lab should have matching data for alarm limits for the oil in that component. If none exists, then the lab may use a general industry guideline for these limits.

Therefore, if the actual value of the oil either exceeds or is below the limit, then this value will be flagged and the user notified. As seen in the report, there are basic sections into which these values are broken up, namely; metals, contaminants, additives and physical tests. Depending on the OEM, there will be different limits for these values.

However, our teams need to be able to identify what the presence or absence of the elements mean for different components.(Bureau Veritas, 2020) compiled a listing to help report readers understand this better as seen below.

fig4-et
fig5-et
fig6-et
Figure 4. Identify what the presence or absence of the elements mean for different components (Bureau Veritas, 2020)

Armed with this information, our teams can make more informed decisions. If they start seeing the quantity of Chromium increasing in their engines then this could be a sign of wear on the Liners and rings, shafts, valve train, bearings, shafts and gears, seals. Therefore, some investigations can begin on these components and possible wear can be addressed before the component gets damaged to the point that it can no longer function. Similarly, if they notice particular additives decrease over time such as zinc, then this could indicate that the antiwear additive is being depleted at a faster rate. These tables can guide report readers on what is actually occurring in their oils allowing them to properly plan for maintenance activities.