We recently touched on greases being available in a wide variety based on application but the real question is, “Are all greases compatible?”
The short answer is, “No”.
All greases contain a thickener (which helps with its physical state). Thickeners vary depending on application (such as temperature, water resistance etc). As such, to verify whether two greases are compatible or not, Machinery Lubrication developed a Compatibility Chart based on thickener type.
You can determine the thickener type by looking at your Data Sheet or talking to your OEM.
Not all greases are compatible, so be careful when mixing greases!
We keep speaking about each grease being different based on their thickener type. However, what are the properties that these thickeners give to the grease?
For instance, if I wanted to use a grease for a roller bearing in a very high temperature environment which should I choose?
Can a multipurpose grease work for that application?
Each area of application may be different and while multipurpose greases are widely used there are some areas where it doesn’t add much value. For example, if a heavy equipment operator uses a backhoe to dig into a river, the multipurpose grease can be easily washed off.
When the grease washes off quickly, the pins holding the bucket can become damaged. (The costs to repair or replace one of these pins are ridiculously high!) However, if he used a Calcium based grease, then there wouldn’t be an issue of water washout and the pins could have a longer life.
Above is a table indicating the various uses of greases based on the thickener types. Know your applications and their environments when choosing the right grease!
While we’ve focused on the variances in greases due to thickener types, we haven’t touched much on the differences in base oil viscosity.
With gear oils, we need the correct viscosity to allow the gears to turn at the required rate while still being lubricated. If the oil is too thick and the gears are high speed, then the gears will not be lubricated quickly enough and they can become damaged. Similarly, greases are made up of base oil with different viscosities.
Most greases use a viscosity of 220cSt (these are the multipurpose greases). However, greases for electric motors use a base oil viscosity of 100cSt. What’s the difference?
Well, if a multipurpose grease was used for an electric motor the energy used for that motor can be 100W however, if a grease with a base oil viscosity of 100cSt was used, the energy used could be reduced to 70W. Is this significant? Definitely YES!!!
On any manufacturing plant, there are at least 5 – 10 electric motors, in some cases there are 70 or more! If at least 25W were saved per motor per month then the company can a significantly reduced power bill at the end of the year!
Understand your applications before applying “any” grease!
The grease thickener has a crucial role in deciding the environment in which a grease should be applied.
One of the major environmental conditions revolves around the operating temperatures that greases have to endure.
If the grease goes past its dropping point then it can turn into a liquid, leak out of its designated area and cause the element to be starved for lubrication. Not to mention the mess on the outside of the component after it has leaked out.
Each thickener has a range of operating temperatures. However, some consideration should be applied when designating areas for the application of the grease. As indicated above, a good rule of thumb is to ensure that the application range of the grease does not exceed the Dropping point - 50C. For example, a good operating range for a simple Lithium grease can be 175-50C = 125C. This still falls within the maximum service temperature for a grease with this thickener.
Pay careful attention to your operating temperatures when selecting your grease!
Of course it does! That’s why it was invented and classed into different categories for various applications! NLGI stands for National Lubricating Grease Institute, they are composed of companies that manufacture and market all types of lubricating grease.
An NLGI grade can start at 000 (very fluid) to 6 (block like). However, there are different grades for different applications.
For instance, most trucks have a centralized lubrication system. As such, the grease needs to be almost fluid like to get to all the areas. In these cases, a “00” or even “000” grease may be used. However, the most common grade is a “2” grade which is seen frequently in cartridges, pails etc. Some electric motors require a “3” grade grease instead of a “2”.
Here is a table that describes each of the grades, their applications and consistency.
Always check with your OEM to ensure that the correct NLGI grade is being used! Here is another graphic that likens these grades to more easily identifiable consistencies.
Quite often when we are correcting or helping companies set up their lubrication storage areas, we get asked a lot of questions regarding colour coding.
Ideally, the concept of colour coding is to allow field personnel to easily identify and associate particular lubricants with their applications.
However, like most things in reliability, this can be customized to suit your organization. There are no hard and fast rules of using only yellow to represent hydraulic oils.
What if we had someone that was colour blind?
Usually, when we start colour coding lubricant storage containers, we include symbols and actual names of the lubricant. This helps to assist personnel in having a 3 point verification system.
First they can verify the colour, then the symbol and of course the name of the lubricant.
Names are crucial! Especially for varying viscosities (such as gear or hydraulic oils). For instance all gear oil would have the same colour and symbol but you wouldn’t want to put an ISO 100 gear oil in a gearbox suited for ISO 680.
Audits usually get people nervous! They are worried about what the auditor may or may not find. When we perform lubrication audits, we’re trying to ensure that your equipment is using exactly what it should to perform efficiently.
Why is that necessary? We’ve found that in most organizations, there may have been a time when the OEM recommended lubricant was not readily available and a substitute was used instead. Once the substitute has been used, it magically becomes the recommended lubricant for the rest of the life of the component.
However, if proper checks were not done initially, then the component could be using the wrong lubricant for most of its life. This can contribute to downtime and replacement of parts before their actual useful life has been reached.
Once, we found a gearbox using an ISO 680 gear oil when it should have used an ISO 320 oil. This gearbox used the wrong oil for 30 years! It greatly impacted the efficiency of the gearbox and they experienced numerous breakdowns throughout its life but they never understood or dared to look at the lubricant.
Always ensure that you have the OEM recommended lubricants for your components!
A lot of people get confused when reading the ISO 4406 rating. The rating specifies a range of the number of particles of certain sizes that can pass through 3 particular sized filters namely; 4micron, 6 micron and 14 micron filters respectively.
For instance; a rating of 13/11/8 indicates:
13 represents 40-80 particles over the size of 4um
11 represents a range of 10-20 particles over the size of 6um and
8 represents a range of 1.3-2.5 particles over the size of 14um.
These values are actually the number of particles per milliliter. It does not mean that you have 13, 11 or 18 particles only in your oil, it's much more than that!
There are different ratings for different levels of cleanliness.
If your numbers are really high (25/22/19) then there’s definitely a high level of contamination! (the full chart goes up to 28 and all the way down to 0).
Different components have different ISO cleanliness ratings. For instance, a roller bearing has a higher cleanliness target than a Variable Vane pump.
Understanding the ISO 4406 codes are crucial for determining the steps needed in “cleaning up” your system lubricants.
However, when we test for the cleanliness of an oil, there are a couple things that we need to consider:
When testing, we have exposed the oil to the elements (highly dependent on the method of sampling)
Results are not instantaneous (even with an onsite lab, there will be a timeframe between collecting the sample and processing it)
Since there are lag times involved, the value that is reported for the ISO4406 rating is never really truly representative of the oil. As such, when analysing the results of this test, it is important to consider that the actual value may potentially be higher than reported.
Quite often, when lubrication failures occur, the first recommended action is to change the lubricant. However, when the lubricant is changed, the real root cause of the lubricant failure has not been solved. As such, the cause of lubrication failure will continue to be present and may escalate further to develop other problems.
Essentially, this can cause catastrophic future failures simply because the root cause was not identified, addressed and eradicated. Moreover, the seemingly “quick fix” of changing the lubricant, is usually seen as the most “cost effective” option. On the contrary, this usually becomes the most expensive option as the lubricant is changed out whenever the issue arises which results in a larger stock of lubricant, loss in man hours and eventually, a larger failure which can cost the company at least a month or two of lost production.
In this article, we investigate lubricant failures in Ammonia plants and their possible causes. Some Ammonia plants have a developed a reputation for having their product come into contact with the lubricant and then having lubrication failures occur. As such, most Ammonia plant personnel accept that the process materials can come into contact with the lubricant and usually change out their lubricants when such issues occur. However, there are instances, where the ammonia is not the issue and plant personnel needed to perform a proper root cause analysis to determine the root cause and eradicate it. Here are a couple of examples of such instances.
Livingstone (1) defies the Lubrication Engineers Handbook in their description of ammonia as an inert and hydrocarbon gas that has no chemical effect on the oil, stating that this is incorrect. Instead, Livingstone (1) lists the number of ways that Ammonia can react with a lubricant under particular reactions such as;
ammonia being a base that can act as a nucleophile which can interact with any acidic components of the oil (such as rust/corrosion inhibitors)
reaction of ammonia with carboxylic acids (oil degradation products) to produce amides which cause reliability issues
transesterification of any ester containing compound to create alcohol and acids and the reaction of ammonia with oxygen to form NOx which is a free radical initiator that accelerates fluid degradation.
As such, one can firmly establish that ammonia influences the lubricant and can lead to lubrication failures should that be the cause of the lubricant failure.
The Use of Root Cause Analysis
Van Rensselar (2) quotes Zhou as saying the best method for the resolving varnish is to perform a root cause analysis. Wooton and Livingstone (3) also advocate for the use of root cause analysis to solve the issue of varnish. They go on to explain that the characterization of the deposit aids in determining the root cause of the lubricant degradation. As such, Wooton and Livingstone (3) have developed a chart to assist in deposit characterization as shown below.
Deposit Characterization graphic from Wooton and Livingstone (3)
Wooton and Livingstone (3) discussed that with the above figure, once the deposit can be characterized then the type of lubricant degradation can be more accurately identified. As such, the root cause for the lubricant degradation can now be firmly established thereby allowing solutions to be engineering to control and reduce / eliminate lubricant degradation in the future.
Case Studies
A case study from Wooton and Livingstone (3) was done with an Ammonia Compressor in Romania which experienced severe lubricant degradation. In this case study, they found that when the in-service lubricant was subjected to two standard tests namely MPC and RULER, both tests produced results within acceptable ranges. As such, there was no indication from these tests that the lubricant had undergone such drastic degradation as evidenced by substantial deposits within the compressor. Thus, it was determined that the deposits should be analysed as part of the root cause analysis.
For the deposits from the Ammonia compressor, Wooton and Livingstone (3) performed FTIR spectroscopy to discover that its composition consisted of mainly primary amides, carboxylic acids and ammonium salts. It was concluded that the carboxylic acids formed from the oxidation of fluid while in the presence of water.
In turn, the carboxylic acids reacted with the ammonia to produce the primary amides. These amides consisted of ammonium salts and phosphate. As such, the onset of carboxylic acids within the system eventually leads to the lubricant degradation. Thus, an FTIR analysisfor carboxylic acids was now introduced to this Ammonia plant as well as MPC testing to monitor the in-service lubricant.
Additionally, chemical filtration technology was implemented to remove carboxylic acids within the lubricant. These two measures allowed for the plant to be adequately prepared for lubricant degradation and avoid failures of this type in the future.
Another case study was done in Qatar with an ammonia refrigeration compressor which was experiencing heavy deposits due to lubrication degradation. For this Ammonia plant, high bearing temperatures and deposits were found on the bearing.
Upon investigation, it was realized that the lubricant had been contaminated externally and there was restricted oil flow to the bearings. After a FTIR was performed it was deduced that that the deposits were organic in nature and there were several foreign elements including high levels of carbon and primary amides.
From further root cause analysis, it was determined that the high temperatures observed were due to the lubricant starvation. Due to these high temperatures, oxidation initiated and with the high levels of contamination (mainly from ammonia within the process) this lead to degradation of the lubricant in the form of heavy deposits.
The bearing oil flow was increased and reduction in external contaminants were implemented. Oil analysis tests of Viscosity, Acid Number, Membrane Patch Calorimetry and Rotating Pressure Vessel Oxidation tests were also regularized in the preventive maintenance program. Thus, for this failure, some operational changes had to be made in addition to increased frequencies of testing. With these measures in place, there would be a reduced likelihood of future failures.
From the case studies mentioned, it can be concluded that ammonia systems have a higher possibility of undergoing lubricant degradation due to the contamination of the lubricant by ammonia gas / liquid due to its properties. However, it must also be noted that the ingression of ammonia into the lubrication system is not the only cause for lubrication failure.
Therefore, it is imperative that a proper root cause analysis be carried out to determine the varying causes for lubrication failure before the ingression of ammonia accepts full responsibility for any such failure.
References:
Livingstone, Greg (Chief Innovation Officer, Fluitech International, United States America). 2016. E-mail message to author, March, 08.
Van Rensselar, Jeanna. 2016. “The unvarnished truth about varnish”. Tribology & Lubrication Technology, November 11.
Wooton, Dave and Greg Livingstone. 2013. “Lubricant Deposit Characterization.” Paper presented at OilDoc Conference and Exhibition Lubricants Maintenance Tribology, OilDoc Academy, Brannenburg, Rosenheim, Germany, United Kingdom, January 22-24, 2013.
This question has caused many sleepless nights and initiated countless discussions within the industrial and even transportation sectors. Before examining the causes for lubrication failure, one must first consider the definition of lubricant failure.
The composition of a liquid lubricant can be described as a combination of base oil and additives (Menezes, Reeves and Lovell 2013, 295). These two components work in tandem to define particular characteristics of the lubricant to perform its functions. According to Menezes, Reeves and Lovell (2013, 296) the five functions of a lubricant include;
the reduction of friction
minimization of wear
distribution of heat
removal of contaminants and
improvement of efficiency.
As such, lubrication failure can then be described as the failure of a lubricant to adequately perform any or a combination of its five functions as a result of the degradation of any of its two components; namely the base oil or additive package. Thus, it can be deduced that lubrication failure is as a result of lubricant degradation.
Now that we understand that a lubricant fails when it undergoes degradation which by extension results in the lubricant not being able to perform any of its functions properly, we need to explore further on the types of degradation that exist. Only then can we really answer the question of how a lubricant can fail.
Barnes (2003, 1536) focuses on three main mechanisms of lubricant degradation namely;
Thermal Degradation
Oxidation and
Compressive Heating (Microdieseling).
One may argue that these three types form the basis of all mechanisms of lubricant degradation.
However, Livingstone, Wooton and Thompson (2007, 36) identify six main mechanisms of degradation namely;
Oxidation
Thermal Breakdown
Microdieseling
Additive Depletion
Electrostatic Spark Discharge and
Contamination.
In this instance, the six identified mechanisms all produce varying identifiable characteristics which lend to these six forming the foundation of identification of lubricant degradation mechanisms. With these six in mind, one would need to be able to determine which degradation mechanism is at work in their facility. Afterwards, methods to treat with these mechanisms must be administered. Firstly, let’s understand each mechanism.
Oxidation
This mechanism involves the reaction of oxygen with the lubricant. According to Livingstone, Wooton and Thompson (2007, 36) oxidation can result in the formation of varnish, sludge, increase in viscosity, base oil breakdown, additive depletion and loss in antifoaming properties of the lubricant.
Barnes (2003, 1536) refers to this phenomenon as the addition of oxygen to the base oil to form:
Aldehydes
Ketones
Hydroperoxides and
Carboxylic Acids.
On the other hand, Wooton (2007, 32) explains that there are three main stages of oxidation namely initiation, propagation and termination. Fitch (2015, 41) explains that:
Initiation entails the production of a free radical via the lubricant and a catalyst.
Propagation involves the production of more free radicals via additional reactions.
Finally, termination entails either the continuation of the oxidation process after the antioxidants have been depleted or the antioxidant stopping the oxidation process.
Microdieseling
Livingstone, Wooton and Thompson (2007, 36) have characterized Microdieseling as a form of pressure induced thermal degradation. They describe it as the transition of entrained air from a low pressure to a high pressure zone which results in the adiabatic compression.
This type of compression results in localized temperatures almost on excess of 1000°C.As such, the lubricant undergoes dramatic degradation. Wright (2012, 14) explains that because of these high temperatures, the bubble interface becomes carbonized. As such, carbon by products are produced and the oil undergoes oxidation.
Electrostatic Spark Discharge
Livingstone, Wooton and Thompson (2007, 36) describe this phenomenon as the generation of static electricity at a molecular level when dry oil passes through tight clearances. It is believed that the static electricity can build up to a point whereby it produces a spark. This spark can induce localized temperatures in excess of 10,000°C which can significantly degrade the lubricant at an accelerated rate.
Van Rensselar (2016, 30) also advocates that Electrostatic Discharge contributes to the formation offree radicals in the lubricant which subsequently results in uncontrolled polymerization. This polymerization of the lubricant gives rise to the formation of varnish and sludge which may deposit on the surface of the equipment or remain in solution. Van Rensselar (2016, 32) indicates that the most common result of Electrostatic Discharge is an elevated rate of fluid degradation and the presence of insoluble materials.
Thermal Breakdown
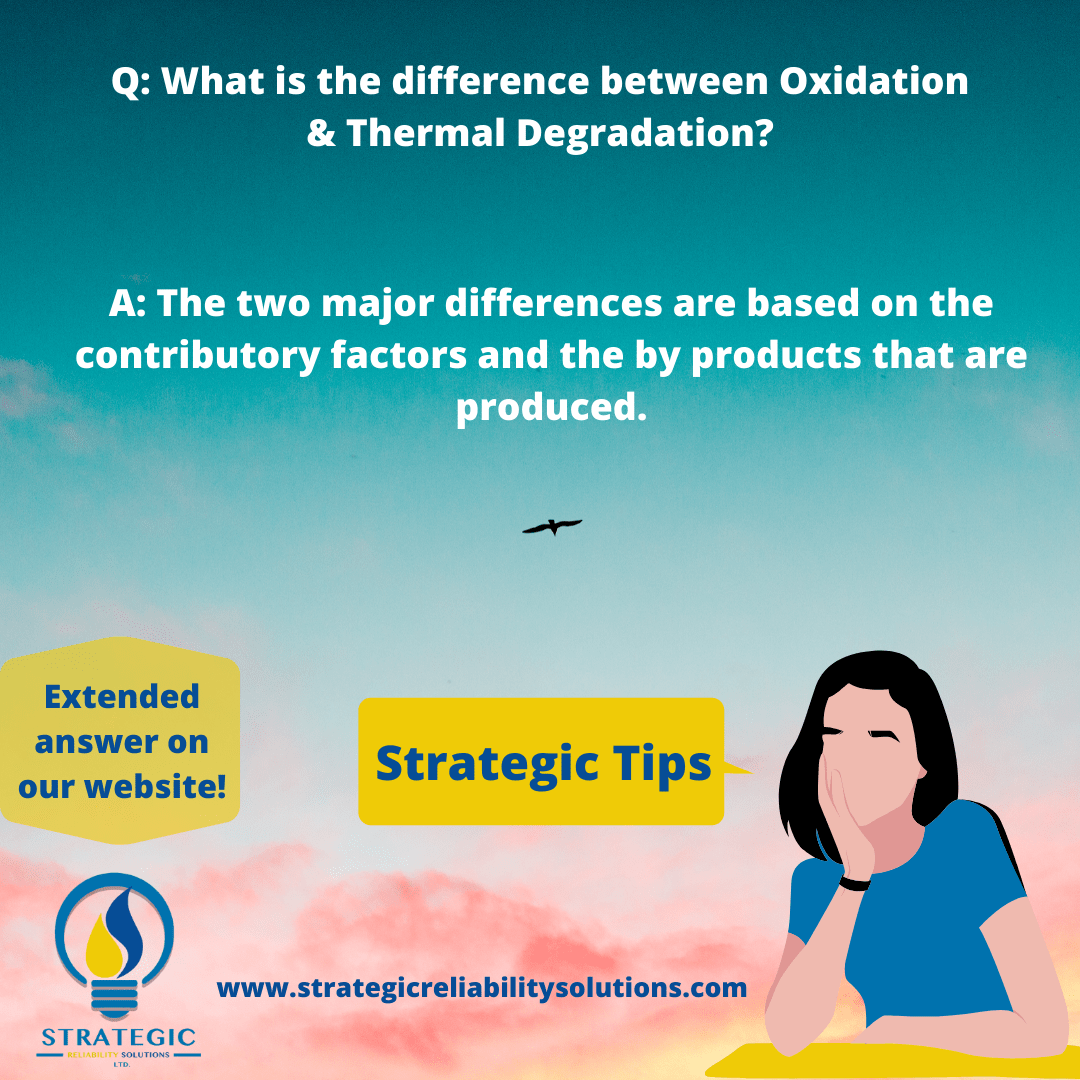
This mechanism is largely dependent on temperature as one of its contributory factors even though dissipation of heat was highlighted above as one of the functions of a lubricant. However, during the operation of machinery particular components tend to develop increasing temperatures.
As described by Livingstone, Wooton and Thompson (2007, 36) once this temperature exceeds the thermal stability point of a lubricant, the consequences can include shearing of the molecules. This phenomenon is also called the thermal cracking of the lubricant which can result in the production of unwanted by products, polymerization and decrease in viscosity.
Subsequently, Barnes (2003, 1536) explains that thermal degradation usually occurs when the lubricant experiences temperatures in excess of 200°C. He also states that the by-products of thermal degradation differ from that of oxidation.
Wooton and Livingstone (2013) state that there are two main actions that can occur once a lubricant is thermally degraded.
Either the small molecules will become cleaved off and volatize from the lubricant. This does not leave any deposit in the lubricant.
On the other hand, there is the condensation of the remainder of the molecule in the absence of air thus dehydrogenation also occurs. Consequently, coke is formed as the final deposit with numerous types of deposits forming between the start of the condensation to its final deposit of coke.
The main contributing factor for thermal degradation can therefore be linked to dramatic increases in temperature or constant high temperatures.
Additive Depletion
Wooton and Livingstone (2013) indicate that additive depletion can result in either organic or inorganic deposits. The nature of the deposit is dependent on the type of additive that has been depleted and its reaction with other components in the oil.
For instance, if the rust and oxidation additives drop out of the oil, they typically react to form primary antioxidant species thus producing organic deposits. However, as Wooton and Livingstone (2013) explain, inorganic deposits can also be formed from additives that have dropped out of the oil but did not react with anything. This unresponsive reaction is typical of ZDDP (Zinc dithiophosphate) which is an additive that assists with reducing wear in the lubricant.
In cases of additive depletion, the FTIR test seeks to identify spectra relating to the reacted or unreacted additive packages for the lubricant in use (Wooton and Livingstone, 2013).
Contamination
This mechanism of degradation can include foreign material entering the lubricant and being used as catalysts for degradation mechanisms listed above. Contaminants can include a variety of foreign material, however Livingstone, Wooton and Thompson (2007, 36) have narrowed the list to metals, water and air. These main contaminants can significantly contribute to the degradation of the lubricant by oxidation, thermal degradation or compressive heating.
From the above, we can summarize these lubricant degradation mechanisms into the following table:
From this summary, we can now assess the methods in which a lubricant can fail. While this article may serve as a guide in determining various lubricant degradation mechanisms, each mechanism must be treated differently depending on the conditions (environmental and operational) that exist during the lubricant failure. A proper root cause analysis should always be done when investigating any type of failure.
References
1 Livingstone, Greg, Dave Wooton, and Brian Thompson. 2007. “Finding the Root Causes of Oil Degradation.” Practicing Oil Analysis, Jan – Feb.
2 Barnes, M. 2003. “The Lowdown on Oil Breakdown.” Practicing Oil Analysis Magazine, May-June.
3 Livingstone, Greg and David Oakton. 2010. “The Emerging Problem of Lubricant Varnish.” Maintenance & Asset Management, Jul/Aug.
4 Wooton, Dave and Greg Livingstone. 2013. “Lubricant Deposit Characterization.” Paper presented at OilDoc Conference and Exhibition Lubricants Maintenance Tribology, OilDoc Academy, Brannenburg, Rosenheim, Germany, United Kingdom, January 22-24, 2013.
5 Van Rensselar, Jeanna. 2016. “The unvarnished truth about varnish”. Tribology & Lubrication Technology, November 11.