The TBN has dropped significantly, can I still use the oil?
The TBN (Total Base Number) is usually seen in diesel engines. Most modern (smaller) diesel engines have TBNs within the range of 9-15 (especially if they are using ULSD).
The TBN gets depleted when the acids in the oil start to increase.
Typically, higher sulphur levels in the fuel produce more acids. As such, as the sulphur level increases, so does the TBN level.
For instance, in power plants that use larger (older) diesel engines that require HSFO (High Sulphur Fuel Oil, 3.5% sulphur), the TBN of the lubricant can be as much as 50. Here are the different types of fuel and their sulphur ratings:
HFSO (High Sulphur Fuel Oil): 3.5%
LSFO (Low Sulphur Fuel Oil): 1.0%
ULSFO (Ultra Low Sulphur Fuel Oil): 0.1%
With IMO 2020, the cap has been placed on sulphur in fuel to 0.5% for marine vessels. While this cap has not yet been translated to land applications, due to the demand for HSFO declining there may be a shift to ULSFO in land based applications in the not so distant future.
Ideally, if your TBN level gets depleted by 50% then there is a cause for concern and the oil should be changed or topped up with new oil (depending on which is more convenient).
If your TBN levels get to 50% in a very short time, you may want to investigate the reasons behind the value dropping so significantly in such a short time (perhaps fuel dilution or thermal cracking?).
Always investigate the reasons behind unexpected results as these will continue to impact your lubricant in the future.
In used oil analysis, oil samples can be taken at any time, but one should always consider the insight that they are trying to gain before testing the sample. This is crucial in deciding the type of tests and the intervals at which they should be performed.
For instance, if we are testing the quality of the oil or we want to compare a fresh batch to a used one, then we can take a sample directly from the drum.
If we are trying to decide the rate at which the additives are being depleted or wear being accumulated then we can take a sample at different operating hours to trend the data. This method can work if we are trying to determine the most appropriate run time for a lubricant in particular conditions.
However, if we are trying to track the health of the components on a regular basis as part of our PM program then taking a sample at the end of the scheduled maintenance interval is desired.
Taking an oil sample from a component is like performing a blood test by the doctor. It helps us to understand what’s really happening. It can show us if there is excessive wear, contamination or lubricant degradation which allows us to identify its “health”. However, the correct tests need to be carried out to determine these conditions.
There must be a reason behind taking the oil sample, not just a random act. When trying to establish a trend regarding a particular aspect of the oil, this should guide your choice of tests otherwise we can end up paying for tests that do not add value.
Always ensure sound reasoning behind testing rather than just checking the box!
While taking an oil sample at the end of the scheduled operating hours is very convenient, is it truly efficient?
When a piece of equipment is scheduled for maintenance, it is usually taken out of service for a couple of hours to perform the assigned
maintenance tasks.
However, if an oil sample is taken a couple days in advance of the scheduled maintenance, then when the results return the maintenance team can be on the lookout for issues highlighted by the results.
For instance, if the value for iron was significant or rising then they can perform inspections for areas which may cause this type of wear and address this challenge while the equipment is offline.
The graphic on the side can be used as a quick guide to determining when to take a sample.
Remember to always evaluate the reason behind establishing the sampling frequency before scheduling sampling.
What the difference between Shelf Life and Service Life?
There’s a major difference between Shelf life and Service life especially when it concerns lubricants!
No one wants to put expired lubricants into their equipment! This can cause unexpected failures which can lead to unplanned downtime which can continue to spiral down the costly path of unproductivity!
Shelf Life
The Shelf life is usually what is stamped by the Manufacturer indicating the length of time the product can remain in its current packaging before being deemed unsuitable for use. These can typically be found on the packaging.
Service Life
The Service life however is determined by the application and conditions under which the lubricant is being used. Usually, estimated running hours / mileage are given by the equipment manufacturer in the maintenance section of the manual. (Condition monitoring can also be used to determine appropriate service intervals.)
However, how will someone know if the product has deteriorated while still in its original packaging? What should someone typically look for?
Above are some tips for identification of deterioration in lubricants. Take a note of these for the next time you are unsure of the integrity of your lubricants.
Are you storing lubricants under the correct conditions?
These questions have come up a dozen times during audits and countless warehouse meetings!
To answer these questions, there are five main conditions that can affect lubricants. We have detailed them along with the effects of these conditions on the lubricant.
Temperature – if incorrect can lead to oxidation. For every 10C rise in temperature above 40C the life of the lubricant is halved.
Light – too much can lead to oxidation especially for light sensitive lubricants such as transformer oils. Hence the reason that most packaging is opaque.
Water – this usually works with additives to cause their depletion or contamination of the product. Water in any lubricant is bad (especially for transformer oils as they are involved in the conduction of electricity.
Particulate contamination – contamination can occur by air borne particles if packaging is left open or if dirty containers/vessels are used to transfer the lubricant from its packaging to the component.
Atmospheric contamination – this affects viscosity and promotes oxidation and can occur if packaging is left open. For instance, if a drum is not properly resealed or capped after usage or the most common practice of leaving the drum open with the drum pump on the inside.
Different types of lubricant degradation
Why is it important to know the types of lubricant degradation?
It’s important since it helps us to figure out why or in some instance how, the lubricant degraded! Usually degradation is the change that occurs when the lubricant can no longer execute its five main functions:
the reduction of friction
minimization of wear
distribution of heat
removal of contaminants and
improvement of efficiency.
There are 6 main types of Lubricant Degradation as detailed below. Each type produces various by products which can enable us to understand the reason for the degradation and eliminate that / those reasons.
Here are the 6 main types of Lubricant Degradation:
As discussed, each mechanism produces distinct results which help us in their identification! Check out our article on why lubricants fail for more info!
What’s the difference between Thermal Degradation and Oxidation of a lubricant?
The two major differences are the contributory factors and the by products that are produced.
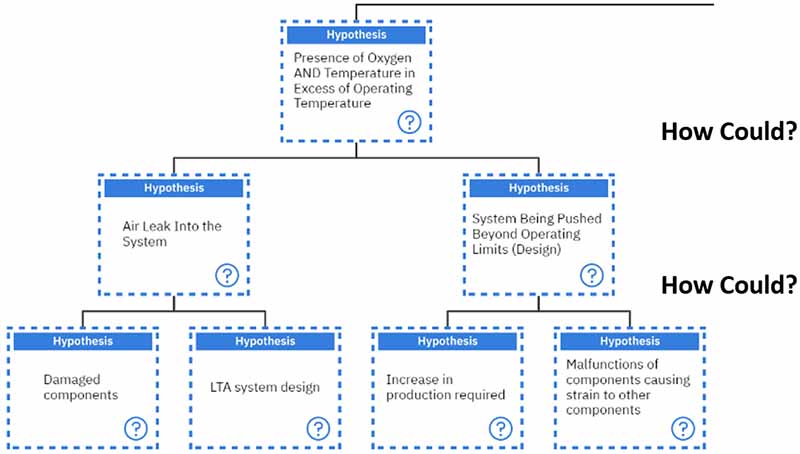
For oxidation, both oxygen and temperature are critical to the degradation of the lubricant however, in thermal degradation, the temperature of the lubricant exceeds its thermal stability (usually in excess of 200°C).
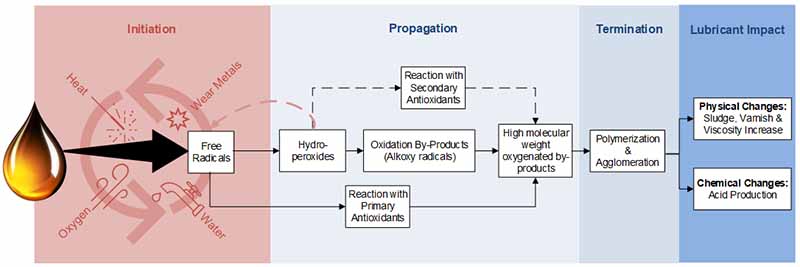
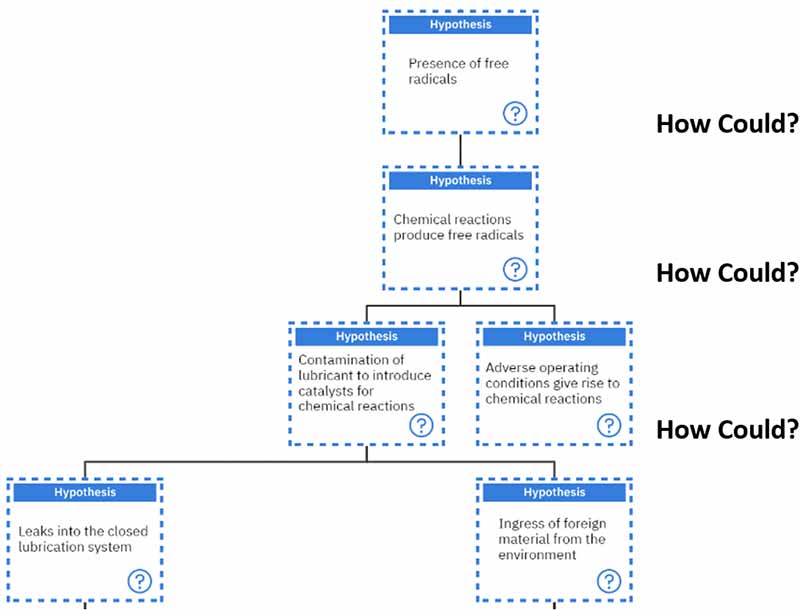
Oxidation usually occurs through the release of free radicals which deplete the antioxidants however, Thermal Degradation consists of polymerization of the lubricant.
Oxidation produces aldehydes, ketones, hydroperoxides, carboxylic acids varnish and sludge. On the other hand, Thermal Degradation produces coke as the final deposit.
Electrostatic Spark Discharge is real and extremely common for turbine users!
Static electricity at a molecular level is generated when dry oil passes through tight clearances.
It is believed that the static electricity can build up to a point whereby it produces a spark.
There are three stages of ESD.
1. Static Electricity builds up to produce a spark – Temperatures exceed 10,000°C and the lubricant begins to degrade significantly.
2. Free radicals form – These contribute to the polymerisation of the lubricant
3. Uncontrolled polymerisation – Varnish and sludge produced (some may remain in solution or deposit on surfaces) which can also result in elevated fluid degradation and the presence of insoluble materials.
Quite often when we are correcting or helping companies set up their lubrication storage areas, we get asked a lot of questions regarding colour coding.
Ideally, the concept of colour coding is to allow field personnel to easily identify and associate particular lubricants with their applications.
However, like most things in reliability, this can be customized to suit your organization. There are no hard and fast rules of using only yellow to represent hydraulic oils.
What if we had someone that was colour blind?
Usually, when we start colour coding lubricant storage containers, we include symbols and actual names of the lubricant. This helps to assist personnel in having a 3 point verification system.
First they can verify the colour, then the symbol and of course the name of the lubricant.
Names are crucial! Especially for varying viscosities (such as gear or hydraulic oils). For instance all gear oil would have the same colour and symbol but you wouldn’t want to put an ISO 100 gear oil in a gearbox suited for ISO 680.
A lot of people get confused when reading the ISO 4406 rating. The rating specifies a range of the number of particles of certain sizes that can pass through 3 particular sized filters namely; 4micron, 6 micron and 14 micron filters respectively.
For instance; a rating of 13/11/8 indicates:
13 represents 4000-6000 particles over the size of 4um
11 represents a range of 1000-2000 particles over the size of 6um and
8 represents a range of 130-250 particles over the size of 14um.
These values are actually the number of particles per milliliter. It does not mean that you have 13, 11 or 18 particles only in your oil, it's much more than that!
There are different ratings for different levels of cleanliness.
If your numbers are really high (25/22/19) then there’s definitely a high level of contamination!
Different components have different ISO cleanliness ratings. For instance, a roller bearing has a higher cleanliness target than a Variable Vane pump.
Understanding the ISO 4406 codes are crucial for determining the steps needed in “cleaning up” your system lubricants.
However, when we test for the cleanliness of an oil, there are a couple things that we need to consider:
When testing, we have exposed the oil to the elements (highly dependent on the method of sampling)
Results are not instantaneous (even with an onsite lab, there will be a timeframe between collecting the sample and processing it)
Since there are lag times involved, the value that is reported for the ISO4406 rating is never really truly representative of the oil. As such, when analysing the results of this test, it is important to consider that the actual value may potentially be higher than reported.
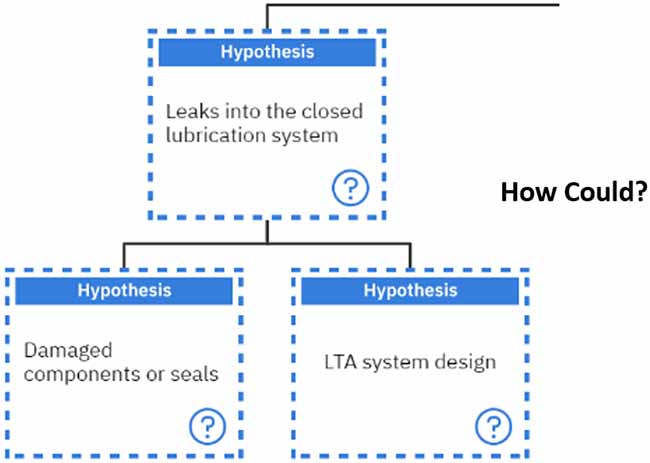
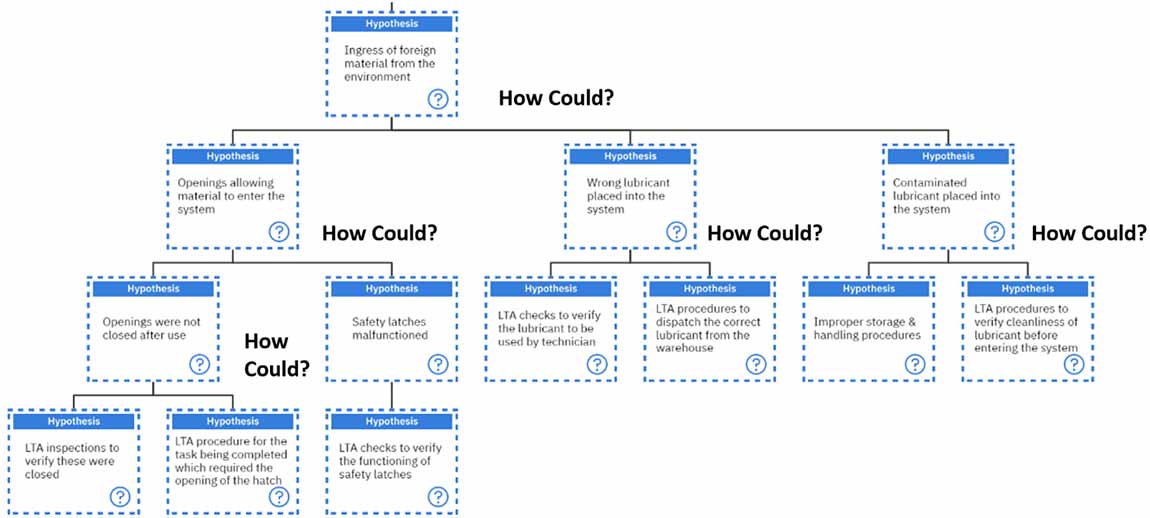
Quite often, when lubrication failures occur, the first recommended action is to change the lubricant. However, when the lubricant is changed, the real root cause of the lubricant failure has not been solved. As such, the cause of lubrication failure will continue to be present and may escalate further to develop other problems.
Essentially, this can cause catastrophic future failures simply because the root cause was not identified, addressed and eradicated. Moreover, the seemingly “quick fix” of changing the lubricant, is usually seen as the most “cost effective” option. On the contrary, this usually becomes the most expensive option as the lubricant is changed out whenever the issue arises which results in a larger stock of lubricant, loss in man hours and eventually, a larger failure which can cost the company at least a month or two of lost production.
In this article, we investigate lubricant failures in Ammonia plants and their possible causes. Some Ammonia plants have a developed a reputation for having their product come into contact with the lubricant and then having lubrication failures occur. As such, most Ammonia plant personnel accept that the process materials can come into contact with the lubricant and usually change out their lubricants when such issues occur. However, there are instances, where the ammonia is not the issue and plant personnel needed to perform a proper root cause analysis to determine the root cause and eradicate it. Here are a couple of examples of such instances.
Livingstone (1) defies the Lubrication Engineers Handbook in their description of ammonia as an inert and hydrocarbon gas that has no chemical effect on the oil, stating that this is incorrect. Instead, Livingstone (1) lists the number of ways that Ammonia can react with a lubricant under particular reactions such as;
ammonia being a base that can act as a nucleophile which can interact with any acidic components of the oil (such as rust/corrosion inhibitors)
reaction of ammonia with carboxylic acids (oil degradation products) to produce amides which cause reliability issues
transesterification of any ester containing compound to create alcohol and acids and the reaction of ammonia with oxygen to form NOx which is a free radical initiator that accelerates fluid degradation.
As such, one can firmly establish that ammonia influences the lubricant and can lead to lubrication failures should that be the cause of the lubricant failure.
The Use of Root Cause Analysis
Van Rensselar (2) quotes Zhou as saying the best method for the resolving varnish is to perform a root cause analysis. Wooton and Livingstone (3) also advocate for the use of root cause analysis to solve the issue of varnish. They go on to explain that the characterization of the deposit aids in determining the root cause of the lubricant degradation. As such, Wooton and Livingstone (3) have developed a chart to assist in deposit characterization as shown below.
Deposit Characterization graphic from Wooton and Livingstone (3)
Wooton and Livingstone (3) discussed that with the above figure, once the deposit can be characterized then the type of lubricant degradation can be more accurately identified. As such, the root cause for the lubricant degradation can now be firmly established thereby allowing solutions to be engineering to control and reduce / eliminate lubricant degradation in the future.
Case Studies
A case study from Wooton and Livingstone (3) was done with an Ammonia Compressor in Romania which experienced severe lubricant degradation. In this case study, they found that when the in-service lubricant was subjected to two standard tests namely MPC and RULER, both tests produced results within acceptable ranges. As such, there was no indication from these tests that the lubricant had undergone such drastic degradation as evidenced by substantial deposits within the compressor. Thus, it was determined that the deposits should be analysed as part of the root cause analysis.
For the deposits from the Ammonia compressor, Wooton and Livingstone (3) performed FTIR spectroscopy to discover that its composition consisted of mainly primary amides, carboxylic acids and ammonium salts. It was concluded that the carboxylic acids formed from the oxidation of fluid while in the presence of water.
In turn, the carboxylic acids reacted with the ammonia to produce the primary amides. These amides consisted of ammonium salts and phosphate. As such, the onset of carboxylic acids within the system eventually leads to the lubricant degradation. Thus, an FTIR analysisfor carboxylic acids was now introduced to this Ammonia plant as well as MPC testing to monitor the in-service lubricant.
Additionally, chemical filtration technology was implemented to remove carboxylic acids within the lubricant. These two measures allowed for the plant to be adequately prepared for lubricant degradation and avoid failures of this type in the future.
Another case study was done in Qatar with an ammonia refrigeration compressor which was experiencing heavy deposits due to lubrication degradation. For this Ammonia plant, high bearing temperatures and deposits were found on the bearing.
Upon investigation, it was realized that the lubricant had been contaminated externally and there was restricted oil flow to the bearings. After a FTIR was performed it was deduced that that the deposits were organic in nature and there were several foreign elements including high levels of carbon and primary amides.
From further root cause analysis, it was determined that the high temperatures observed were due to the lubricant starvation. Due to these high temperatures, oxidation initiated and with the high levels of contamination (mainly from ammonia within the process) this lead to degradation of the lubricant in the form of heavy deposits.
The bearing oil flow was increased and reduction in external contaminants were implemented. Oil analysis tests of Viscosity, Acid Number, Membrane Patch Calorimetry and Rotating Pressure Vessel Oxidation tests were also regularized in the preventive maintenance program. Thus, for this failure, some operational changes had to be made in addition to increased frequencies of testing. With these measures in place, there would be a reduced likelihood of future failures.
From the case studies mentioned, it can be concluded that ammonia systems have a higher possibility of undergoing lubricant degradation due to the contamination of the lubricant by ammonia gas / liquid due to its properties. However, it must also be noted that the ingression of ammonia into the lubrication system is not the only cause for lubrication failure.
Therefore, it is imperative that a proper root cause analysis be carried out to determine the varying causes for lubrication failure before the ingression of ammonia accepts full responsibility for any such failure.
References:
Livingstone, Greg (Chief Innovation Officer, Fluitech International, United States America). 2016. E-mail message to author, March, 08.
Van Rensselar, Jeanna. 2016. “The unvarnished truth about varnish”. Tribology & Lubrication Technology, November 11.
Wooton, Dave and Greg Livingstone. 2013. “Lubricant Deposit Characterization.” Paper presented at OilDoc Conference and Exhibition Lubricants Maintenance Tribology, OilDoc Academy, Brannenburg, Rosenheim, Germany, United Kingdom, January 22-24, 2013.